Instagram insights: three different periods and the metrics that aren't there
90 days for the account, two years for a story and a reel. Word-for-word definitions of views, viewers and initial views — and a list of metrics the Help Centre doesn't describe at all.
- Social media & AI
- Mechanics explained
- ≈ 9 min
Instagram insights are read as if they were one table with one deadline. In fact there are three: 90 days for the account, two years for a story, two years for a reel and nothing before May 2021. And half the metrics people look for in those insights are not described there at all.
Three different retention periods and why comparisons break because of them. Word-for-word definitions of views, initial views and viewers. A list of the metrics the Help Centre doesn't have, so you stop looking for them and stop inventing them. Nine minutes of reading.
90 days, two years and May 2021
Three different periods in one app.
The first thing to know about Instagram insights: there is no single retention period. The help pages name three different ones, and each belongs to its own section.
Account and content insights live for 90 days.
You can view insights on an aggregate or individual post basis, for any time period within the past 90 days. You can choose between the 5 preset timeframe options, or select your own custom timeframe.
Instagram Help Centre · “View account and content insights on Instagram”
Insights for a single story live for two years: the story itself disappears in a day, its numbers stay. Reels insights are two years as well, but with a caveat about the date.
Insights for reels are available for reels posted on and after May 14, 2021. Insights are available to view for up to two years after the reel's original publish date.
Instagram Help Centre · “View insights on your Instagram reels”
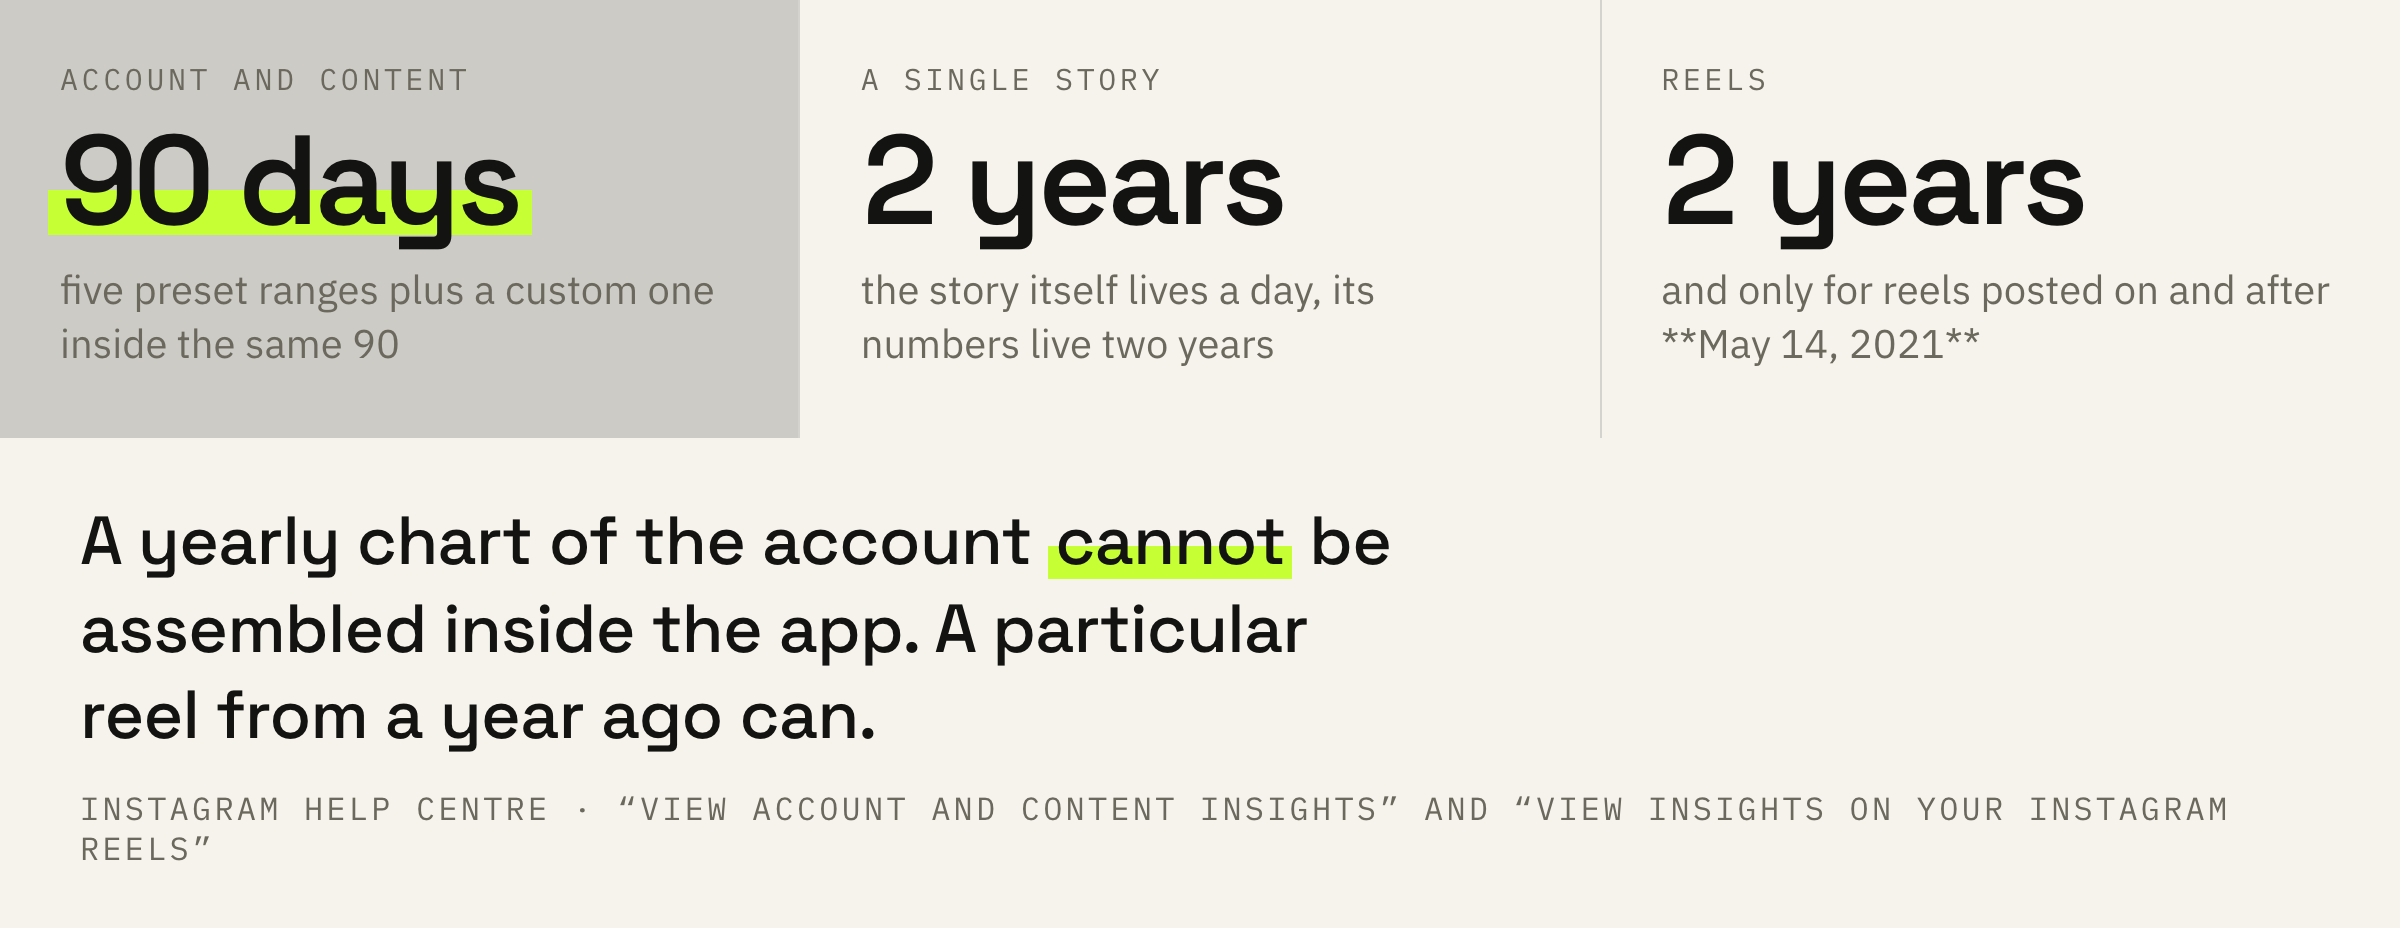
Hence the practical consequence that breaks comparisons. You cannot look at a year of account dynamics: beyond 90 days there is simply no data in the app. A particular reel from a year ago, though, opens fine, and its numbers are all there if it went out after May 2021.
Tables of the “our reach month by month over a year” kind cannot be assembled inside Instagram. If such a table exists, it was either kept by hand from the very start, or built by a third-party service, or invented. The first option is the only reliable one.
Who can see insights at all
Not a professional account — a public one.
A common misconception: insights are only for professional accounts. The Help Centre says otherwise, and the condition is that the profile is public.
You need to have a public (personal or professional) account on Instagram to view insights.
Instagram Help Centre · “View insights on your Instagram reels”
Switching to a private account takes the access away, though not forever.
If you switch back to a private account, you'll lose access to insights. However, you can regain access to past insights data if you switch back to a public account within 90 days.
Instagram Help Centre · “View account and content insights on Instagram”
There is a second threshold people rarely remember. Audience demographics (age, cities, countries) do not open up for everyone: you need a preset timeframe and more than a hundred accounts reached or engaged over it.
instagram.com → “Dashboard” in the left menu → “Insights” for a professional account or “Your dashboard” for a personal one → “Account” or “Content” → pick a timeframe. For reels: the Reels tab on your profile → the reel you want → “Insights”.
Views, initial views and viewers
Three different numbers counting different things.
Next comes the place where people go wrong most often. Reels insights hold views, viewers and average watch time, and these are three different quantities.
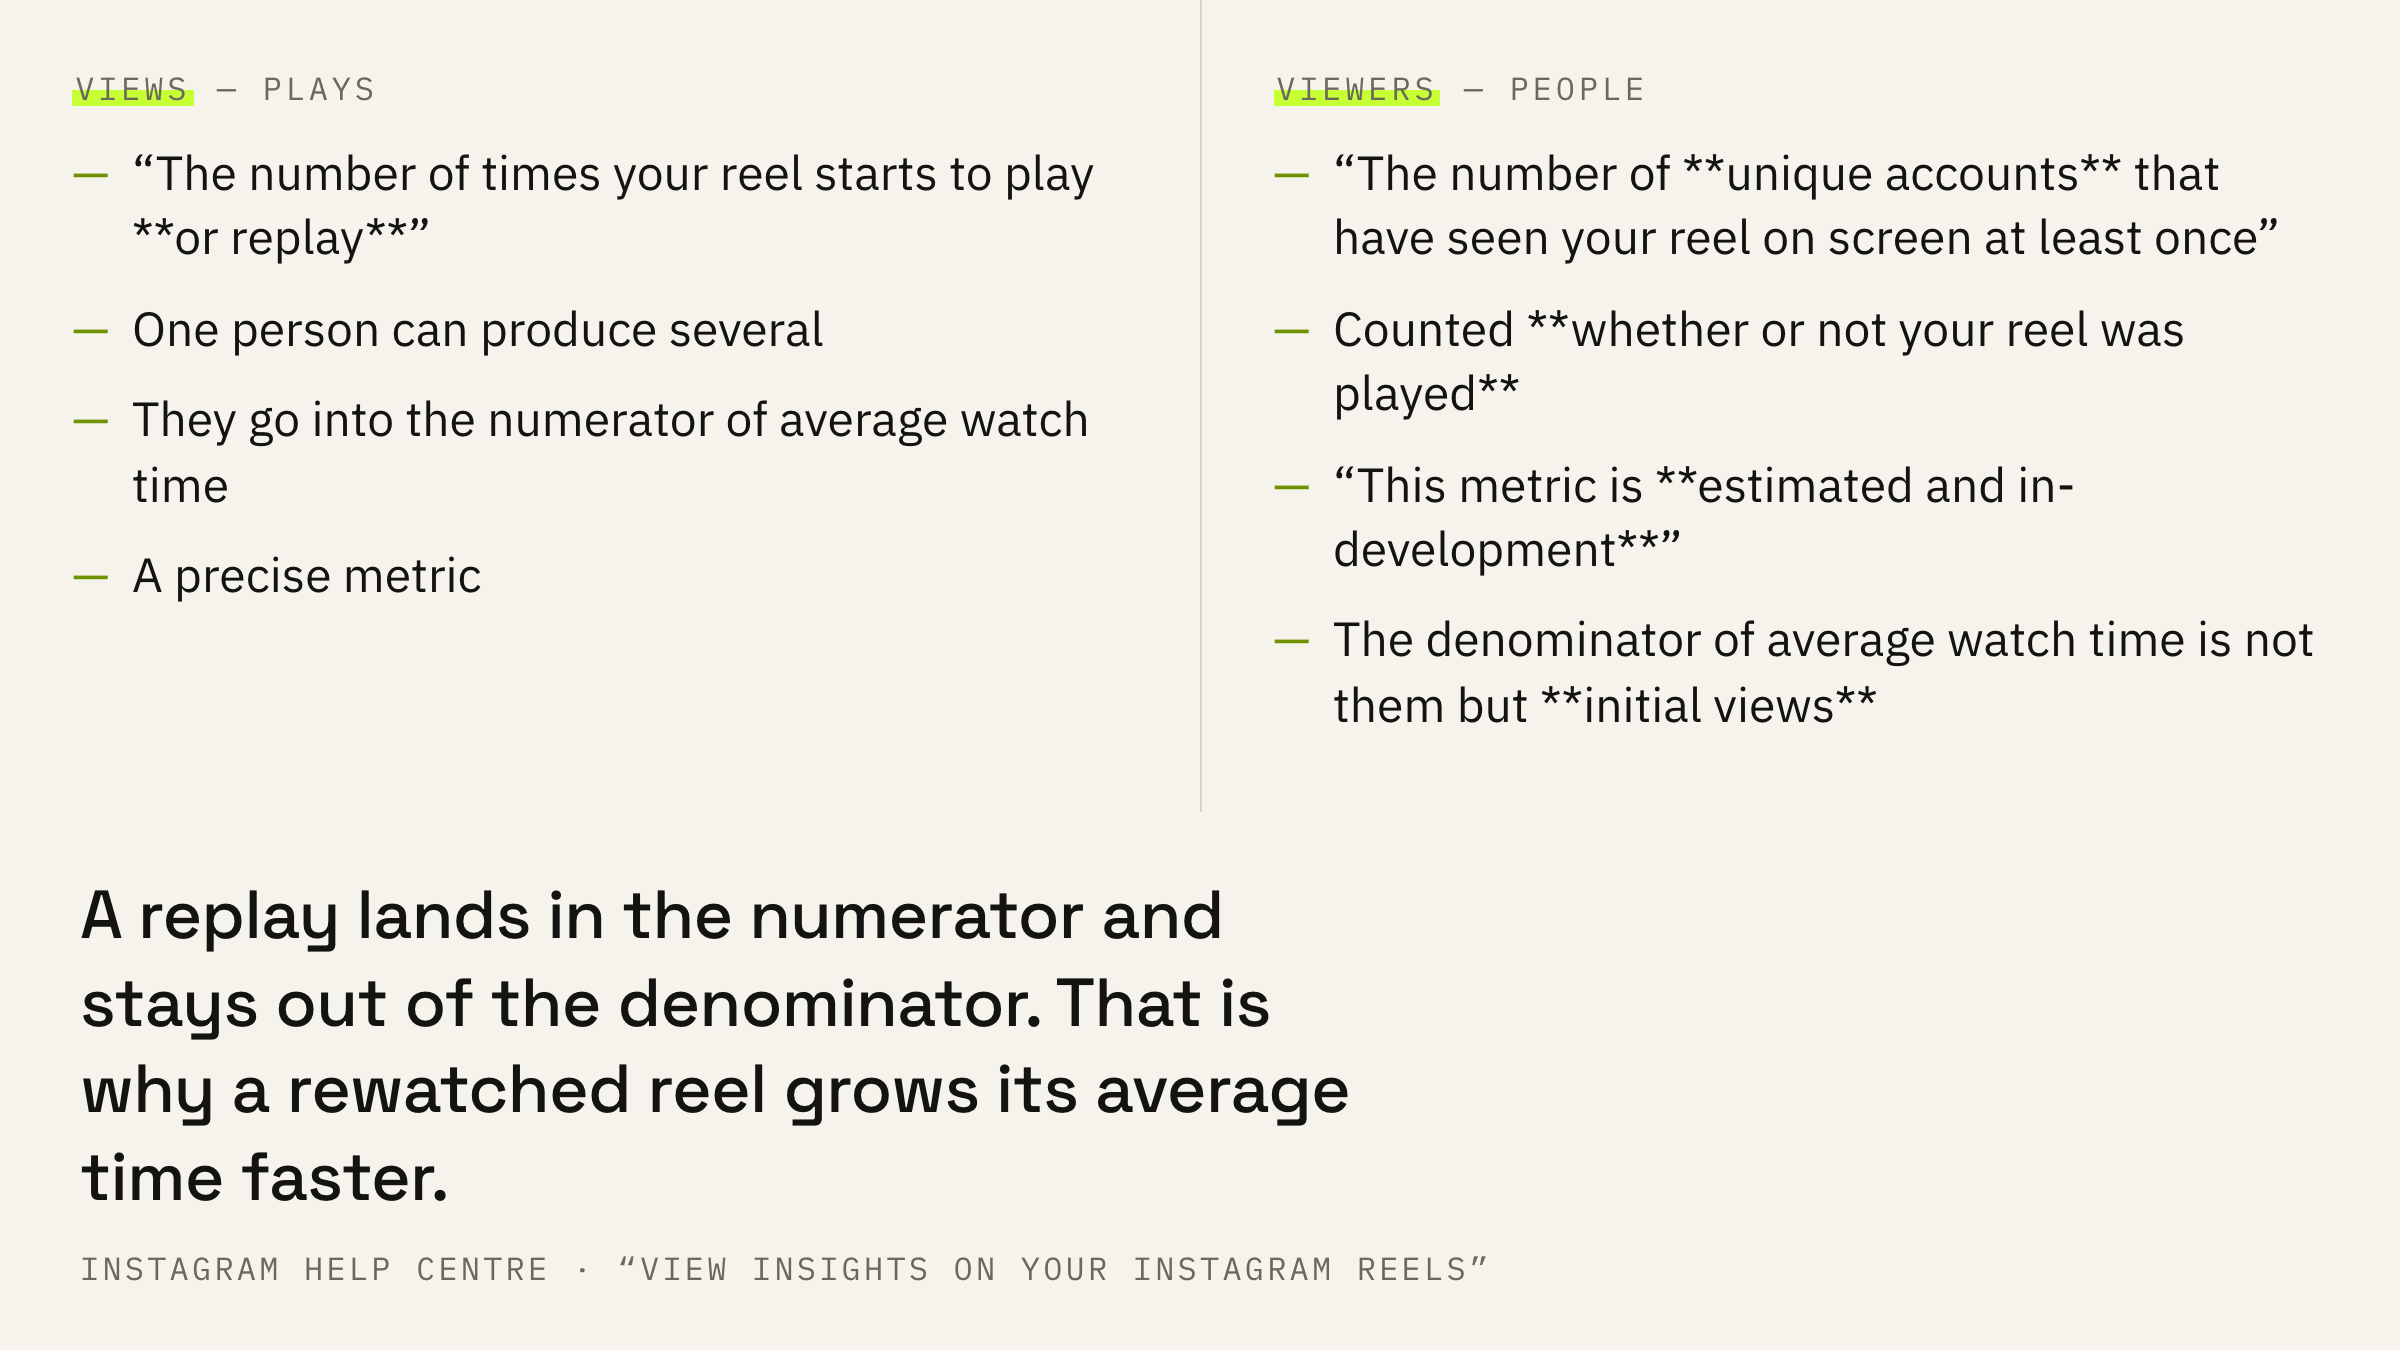
Views: The number of times your reel starts to play or replay.
Instagram Help Centre · “View insights on your Instagram reels”
So one person who watched the clip three times adds three views. Viewers are counted differently and more softly.
Viewers: The number of unique accounts that have seen your reel on screen at least once, whether or not your reel was played. Viewers is different from views, which may include multiple views of your reel by the same accounts. This metric is estimated and in-development.
Instagram Help Centre · the same page
Note two things in that line. A viewer is counted even if the reel never played. And the metric is called estimated by the platform itself.
And a third number nobody talks about, though it is the one that explains why average watch time looks strange.
Average watch time: The average amount of time spent playing your reel. This is calculated by the watch time divided by the number of initial views. An initial view is when your reel starts to play for the first time in a reel session.
Instagram Help Centre · the same page
The denominator here is not “views” but “initial views”. Replays go into the numerator and stay out of the denominator, so for a reel people rewatch the average time grows faster than the view count suggests.
Metrics the Help Centre doesn't have
People look for them, don't find them and invent them.
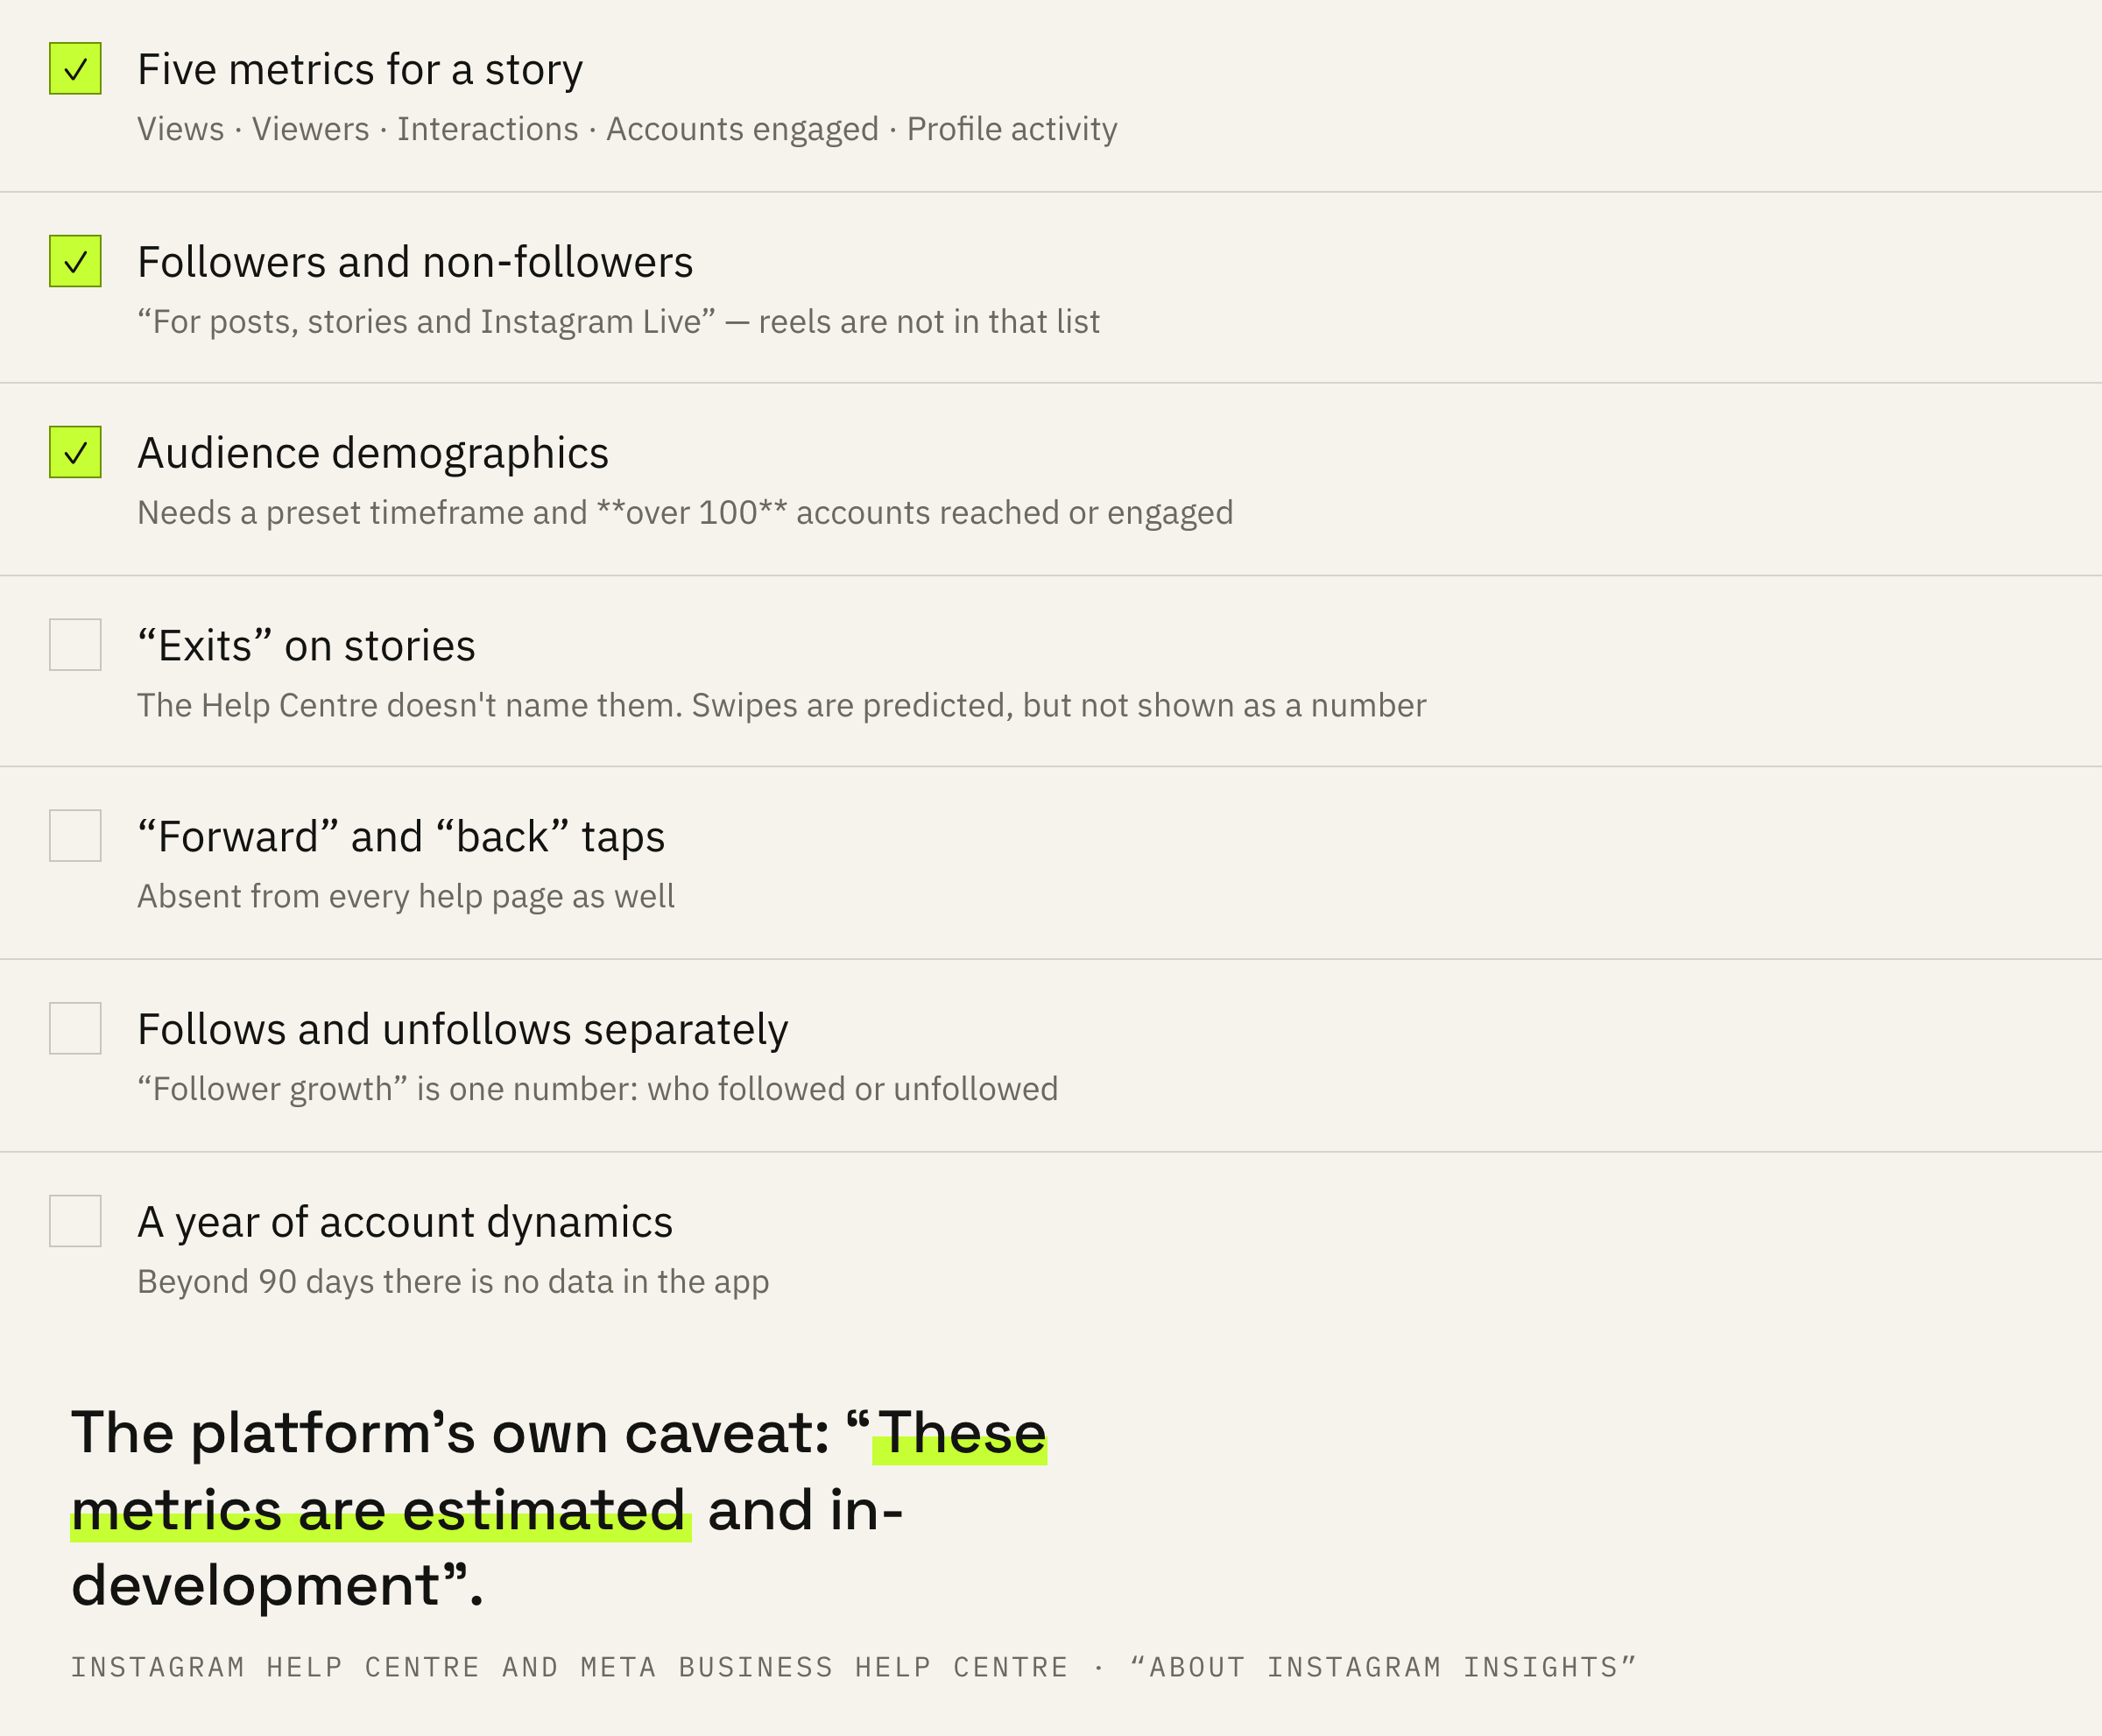
The Help Centre page on story insights names exactly five metrics: views, viewers, interactions, accounts engaged and profile activity. Our breakdown of stories themselves is a separate article; what matters here is something else.
That list has no “exits”, no “forward taps” and no “back taps”. Swipes and exits are predicted by the platform, that is written in the stories system card, but the author is not shown them as separate numbers.
The second gap concerns reels. The breakdown of accounts engaged into followers and non-followers exists, but not everywhere.
For posts, stories and Instagram Live, you can see the Accounts engaged metric broken down into followers and non-followers.
Meta Business Help Centre · “About Instagram Insights”
Reels are not in that list. Which means the question “how many of my reel's viewers were followers and how many weren't” is not answered directly by Instagram insights. The number a third-party service shows is taken from somewhere else.
A third detail of the same kind: follows and unfollows are shown as one number. The Help Centre calls it “Follower growth” and describes it as the number of people who followed or unfollowed you. Two separate numbers the platform does not give.
“These metrics are estimated and in-development.” That line sits right on the insights page. It comes from the platform itself, and there is no arguing with it: the accuracy of some numbers is not guaranteed by their own author.
How to use this
Four actions for three different periods.
First: start your own table and write the numbers into it once a month. That is the only way to have a year of dynamics: after 90 days the app will not show it to you.
Second: compare using the preset timeframes. There are five of them, and demographics only open up on those — a custom range will not show them.
Third: for reels, look at average watch time together with the view count. The first is calculated from initial views, the second includes replays, and the gap between them shows the rewatching. The length of the clip affects this directly.
Fourth: don't look for followers and non-followers in a reel's insights. They are not there, per the Help Centre. For posts, stories and Live the breakdown exists, and honest comparison is possible only inside those formats.
Open your best reel of the month and divide the watch time by the number of views. Then compare the result with the average watch time from insights. If the second is noticeably larger, your clip is being rewatched.
What not to do
Three mistakes that produce false conclusions.
The fourth mistake is subtler than the rest. The platform marks estimated metrics itself, but that mark is rarely noticed — and then a hiring, budget or format decision gets built on such a number.
The rule is simple: the more important the decision, the longer the run of observations it needs. One number on one day says nothing, and a drop in reach certainly isn't diagnosed from a single day.
Every week we go through what Instagram, Threads and Telegram say about themselves: ranking cards, help pages, updates. No invented numbers and no borrowed tables.