How to see your Threads insights and what they actually show
The summary lives on threads.com and on desktop only. We go through the three metrics, the individual-post screen, and why the reply count is almost always larger than the conversations with you.
- Threads
- How-to
- ≈ 8 minutes
People usually look for Threads insights on their phone and don't find them. The help centre documents a path to them for desktop only — and that is the first thing worth knowing. Below: what is shown there, how to read each number, and why one of them is counted differently than it looks.
Two screens: the account summary and the numbers under an individual post. What each metric means and which number Threads doesn't have at all. Eight-minute read.
The account summary
One screen the help centre sends you to from a computer only.
Threads' summary insights live on the website, not in the app. The help centre documents exactly one path to them, and it starts with the words “open threads.com on a computer”.
On threads.com tap “Insights” in the left menu. The last 90 days are shown by default; the range changes through “More options” at the top of the screen.
You don't have to hunt for the screen every time. Insights can be pinned as a column on the home screen: “Options” in the top right, then “Add as column”. The same menu above the column removes it.
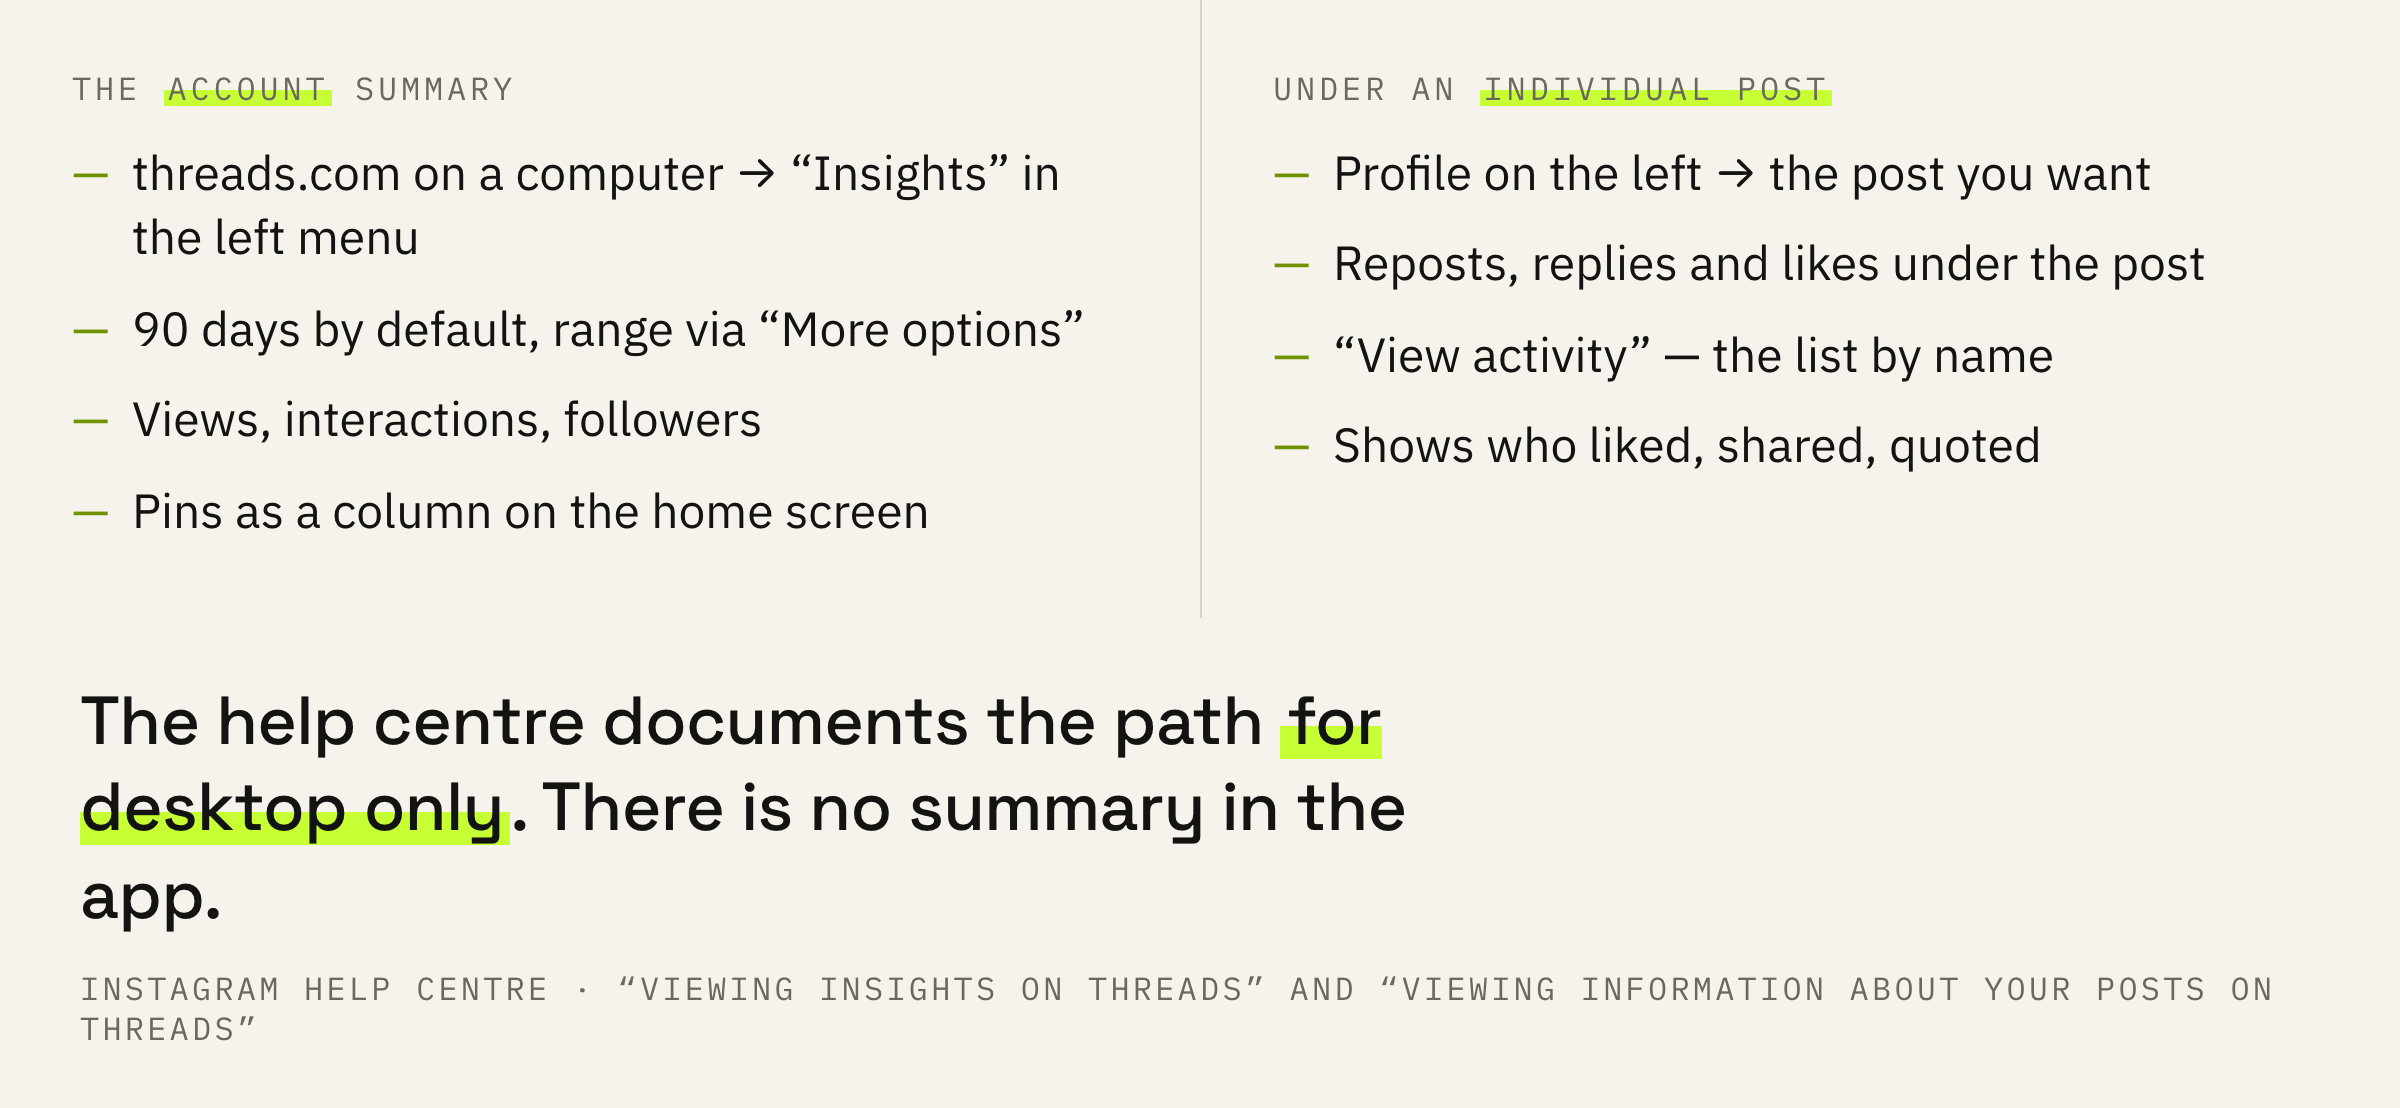
If you looked for insights on your phone and found nothing, it isn't your app version. The Threads help centre documents the path for desktop only, and in this Threads differs from Instagram, where the summary exists in the app as well.
Numbers under an individual post
The second screen: here you see names rather than counts.
The summary answers the question “how are things overall”. For a specific post there is a separate screen, and it's the more interesting one: it shows not only how many but who.
On threads.com tap “Profile” on the left, then the post you want. Underneath it says how many people reposted, replied and liked it. The “View activity” button opens the list of people who liked, shared or quoted it.
This is the only place where someone else's reaction becomes a name. For working with the platform that matters more than summary numbers: the list shows which readers keep coming back to you.
If you have Fediverse sharing switched on, the same lists include likes from other servers, and you can view replies from there and like them.
The three summary metrics
What the platform counts, and with what caveat.
You cannot split views into followers and non-followers on Threads. Instagram has that split, Threads doesn't, and it changes the whole order of diagnosis: the conclusion about who stopped being shown your posts has to be assembled indirectly.
And the caveat the platform makes itself: some metrics are approximate and in development. It stands both on the summary and on the numbers under a post.
Picking apart a few percent between neighbouring weeks is pointless: that sits inside the margin the platform warned about. What is worth looking at is multiples.
How this trait affects the search for a cause when reach drops we covered separately: what to do when posts stop being shown.
The reply count isn't counted the way it looks
One line of the help centre that turns the reading of the number around.
Reply counts to a thread you start will include the count of all replies in the thread, not just those who replied directly to your original post.
Instagram Help Centre · viewing information about your posts on Threads
Which means an argument between two readers under your post grows your reply count exactly as much as someone writing to you does. A post with forty replies may consist of thirty-eight remarks people made to each other.
Open the post and look at who actually replied. The number under the post is a total, the list of replies is the real thing. What to count is people writing to you.
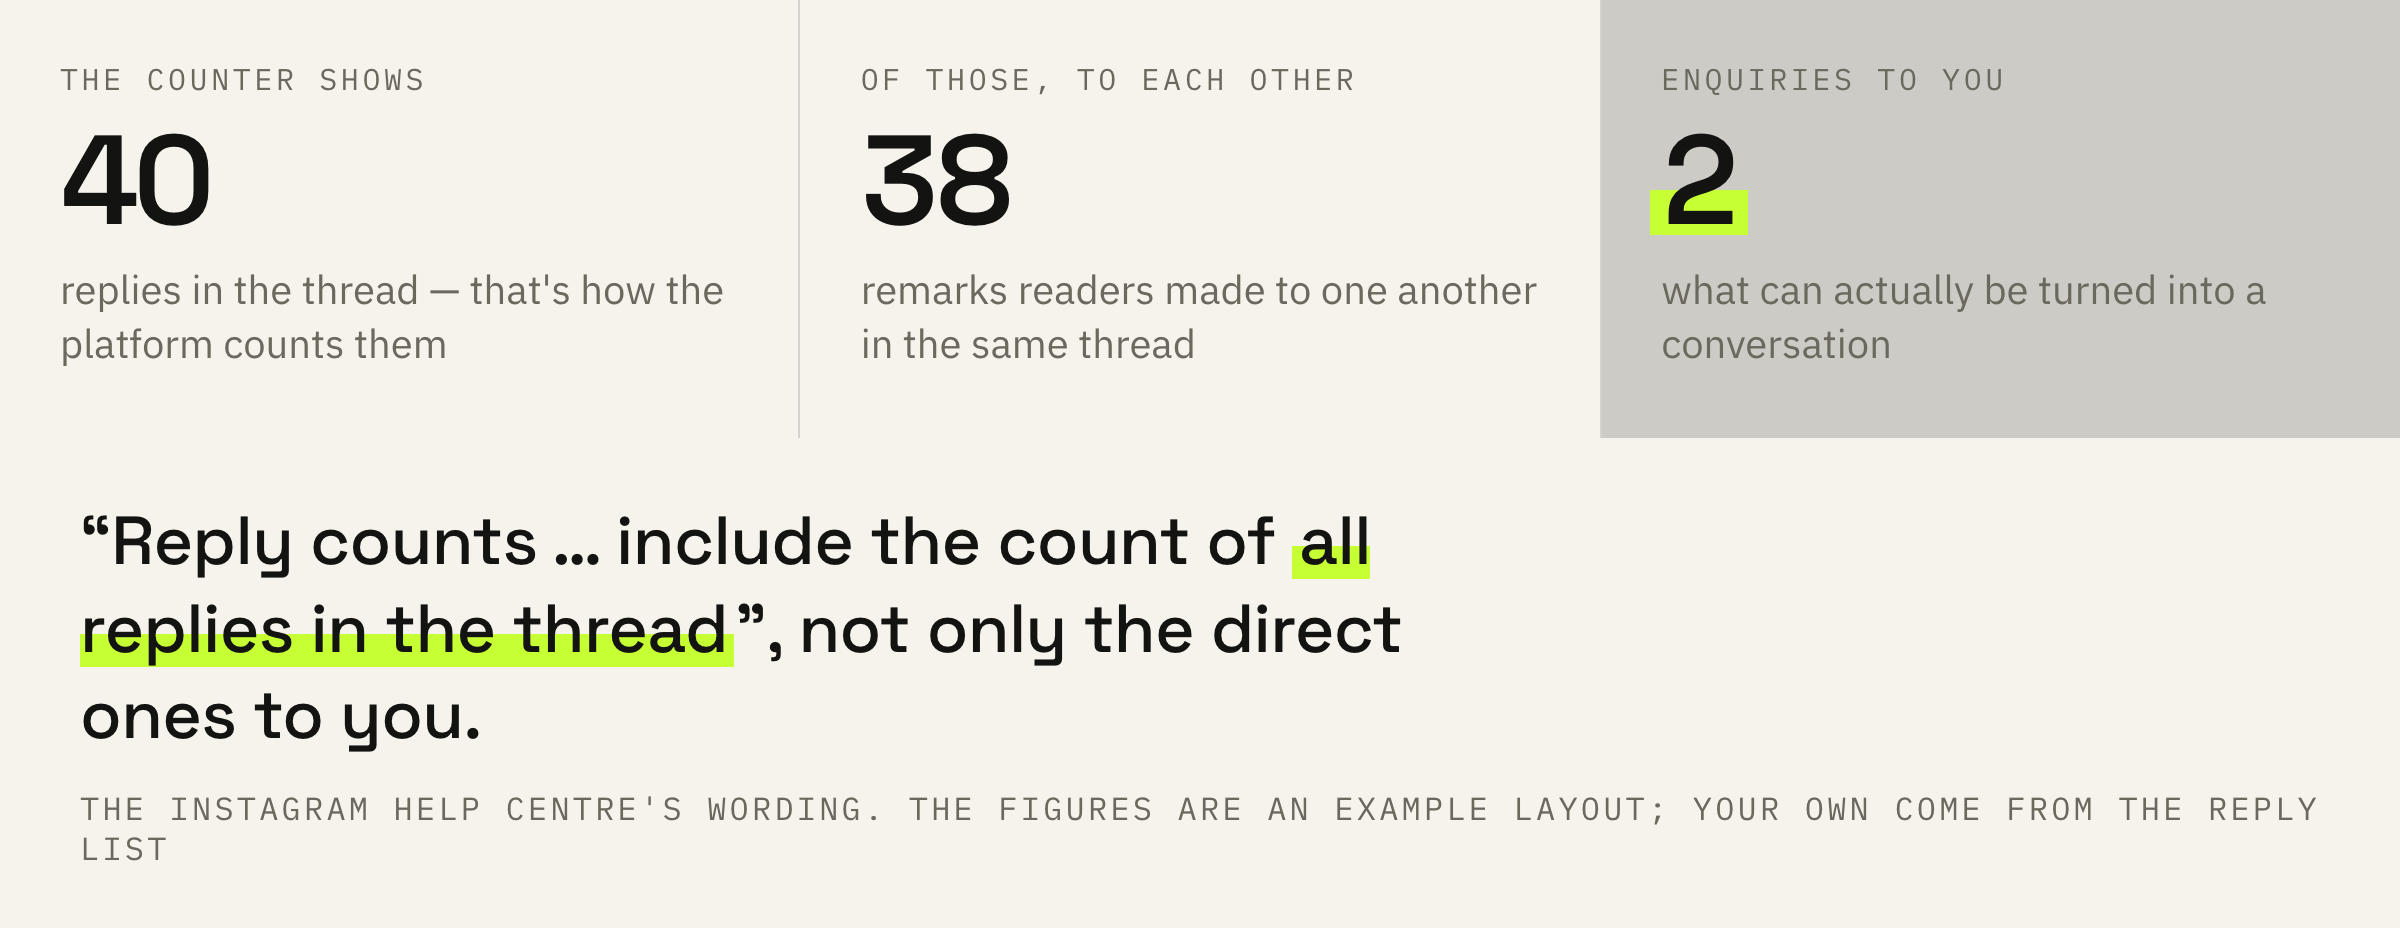
Which gives a practical consequence for anyone running a feed for enquiries. A high reply count doesn't mean people came to you: it means it was lively under the post.
If the numbers grow and enquiries don't, we'll look at your profile and tell you at which step the conversation fails to start.
What to compare your numbers against
Three comparisons the platform doesn't make for you.
First: compare your posts against your own. Take the last ten and the ten before them, matched on format and time of day. The platform gives no ready comparison, so this is done by hand — we write the numbers into a table and count in multiples against our own baseline.
Second: keep the number of DMs next to the reply count. The first grows from any activity under a post, the second only from your work with the reader.
Third: read follower growth as a difference. That is exactly how the platform describes it — as the change in the number of people who followed or unfollowed. It gives no separate unfollow count, so a dip in growth can only be read as a whole.
Top locations and age are the only place that shows who the reach actually brought. If the audience came together from the wrong country and the wrong age, more reach won't solve the problem.
What not to do
Four ways of misreading the numbers.
Why views and results diverge we showed on our own numbers: 5.2M views and two sales.
What to do next
Five minutes at a computer.
Open threads.com, pin insights as a column and write out three numbers for the last thirty days: views, interactions and follower growth.
In a month repeat it and compare against that record. One such table answers more questions than any screenshot of somebody else's.
We'll go through your insights with you, tell you which numbers are normal for you and which signal a problem, and what to change first.
If you want the numbers to turn into enquiries — leave a request. We'll get in touch if there are slots available at the moment. There is usually a queue and a wait.