Why your Stories reach dropped and what to do about it
Stories have no recommendations: they are gathered only from accounts you follow. Three places where reach is lost, five metrics, and a way to build the frame-by-frame drop-off curve by hand.
- Social media & AI
- Diagnostics
- ≈ 11 minutes
Three hundred people used to watch your stories, now it's eighty. The first explanation is always the same: “the algorithm cut me off”. With stories it doesn't hold — they have no entrance for people outside your audience, so there was nobody to stop showing you to.
The three places where story reach is actually lost. The five metrics the platform gives you for stories, and a way to build a drop-off curve out of them by hand. Eleven-minute read.
Stories have no recommendations
The candidate pool is built only from your followers.
Meta describes each of its feeds in a separate document — a system card. Stories have one, last updated 18 September 2025, and its very first step answers half the question.
First, the system gathers all potential stories — excluding advertisements — shared by accounts you follow.
“Instagram Stories AI system”, Meta Transparency Center
That's it. No “part of the public content”, no “similar to what you've engaged with”. A person's story tray holds only the accounts they follow.
Compare that with the neighbouring surfaces. In the feed, recommended content is added to your follows by a separate system. The Reels feed also pulls in videos from similar authors. Stories have no such entrance at all.
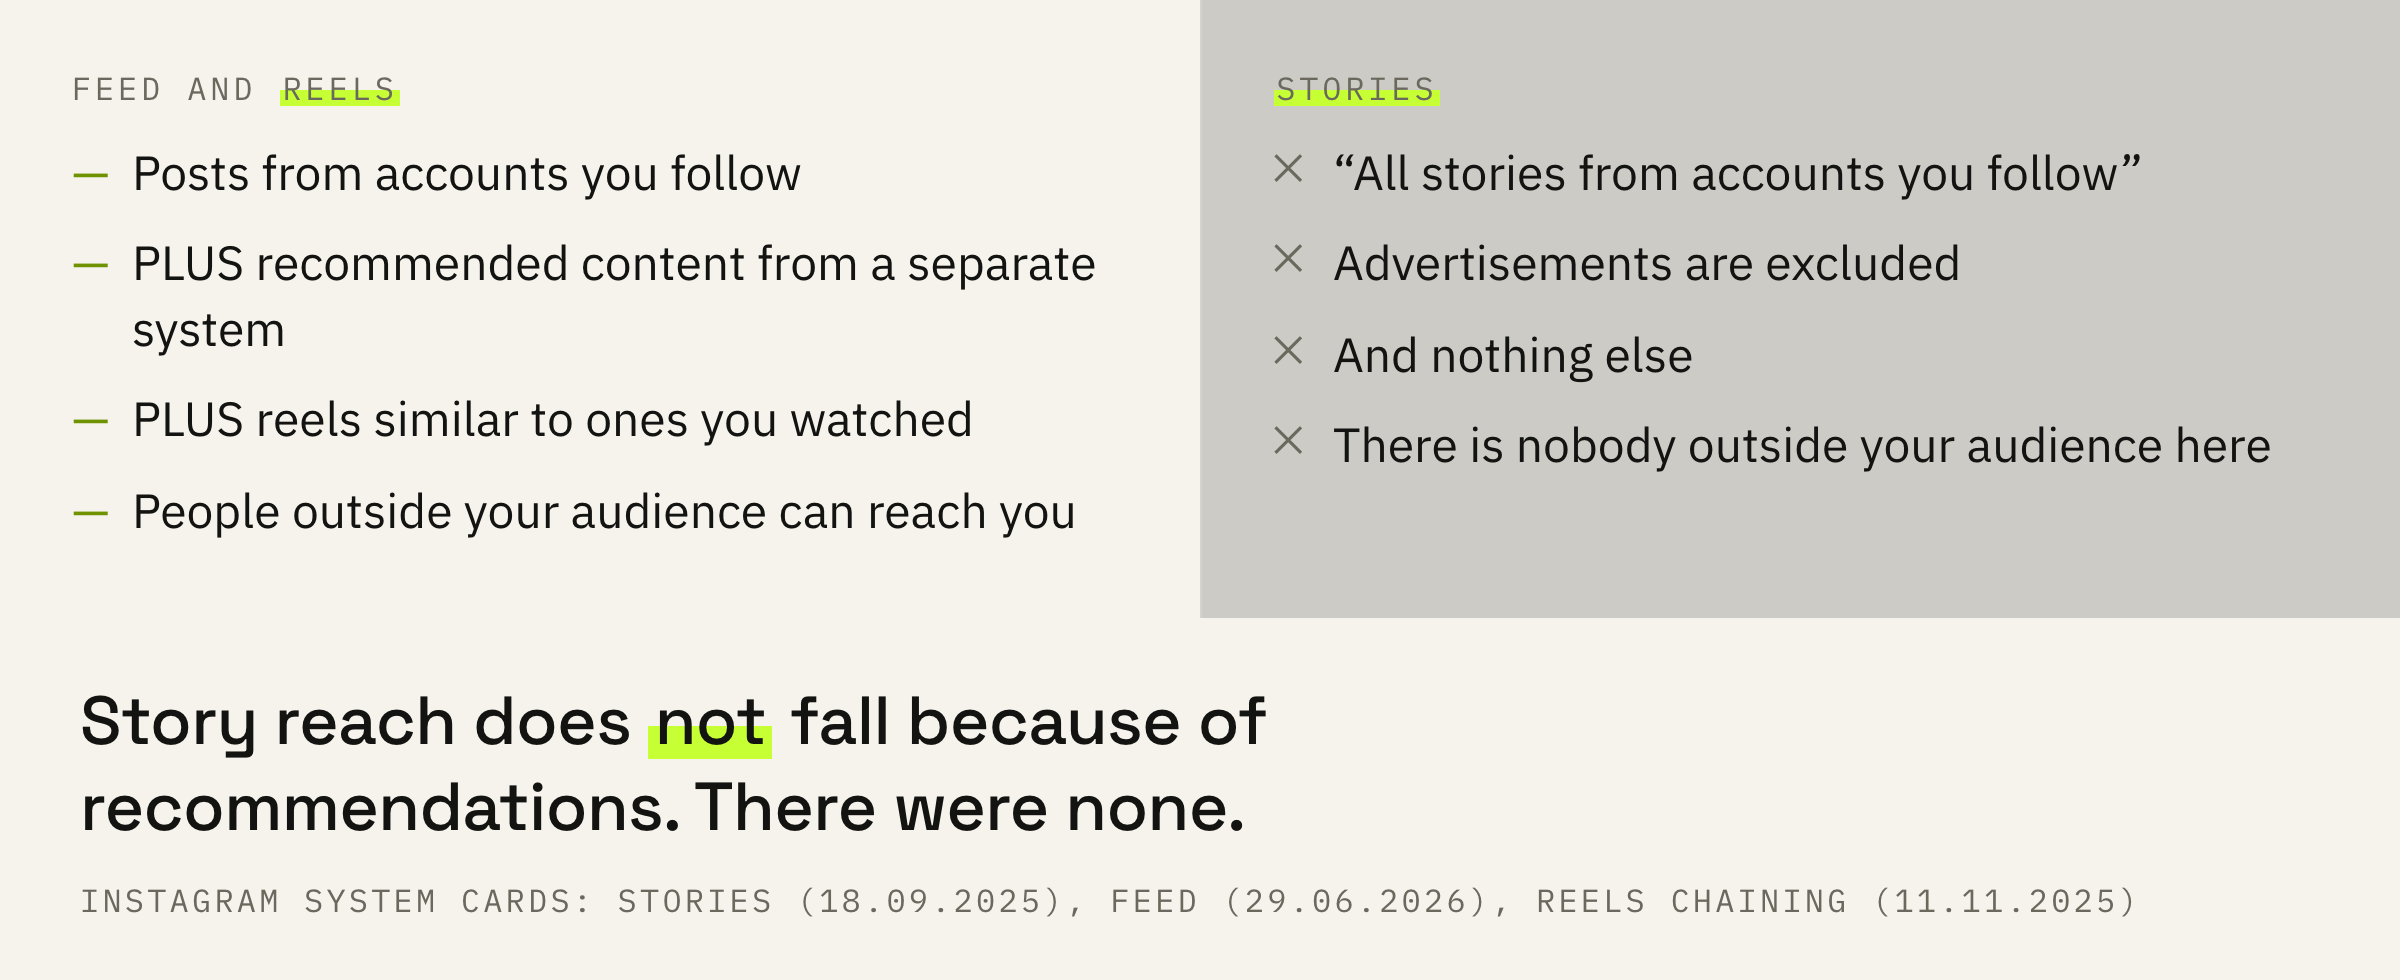
Story reach never dropped “because they stopped showing you to a new audience”. There was no new audience there. One of three things dropped, and all three concern people who already follow you.
If it isn't only your stories but your account reach overall that dropped, the order of checking is different: that one is covered separately, because there recommendations do exist and everything starts with them.
Three places where reach is lost
How many followers opened the app, got to you in the tray, and watched you through.
You can break the drop down across these three places right in the stats, and how to do that is shown below. After that it is clear what to fix: posting rhythm, the first frame, or the length of the set.
One signal that repeats in five of the ten predictions is put bluntly: “How many stories you have not seen”. A person whose tray keeps piling up unwatched gets stories differently from someone who watches everything through.
Five metrics and two years of storage
What the platform gives you for stories and what is missing.
Story stats don't live where account stats live and follow different rules. Let's start with the good part: they don't disappear along with the story.
Although stories expire after 24 hours, you can still access insights for up to two years after they're created.
“Viewing Instagram story insights”, Help Centre
For a live story: “Options” in the top right of the frame, then “View insights”. For an expired one: profile, then “View insights”, then the “Top content by engagement” section. You need a public personal or professional account: private accounts have no insights.
The platform names five metrics for stories, and mixing up the first two costs the most.
The help centre names no separate numbers for “exited”, “tapped forward” or “tapped back”. Swipes and exits are predicted by the system — two of the ten predictions — but the author is never shown them ready-made. Any article that sends you to look at a “story retention chart” is sending you to a screen that doesn't exist.
And one trap with time windows. Account and content stats live within the last 90 days: there are five preset ranges, and the platform names among them 7 days, 30 days, the previous month and 90 days; beyond those you can set a custom range inside the same three months. The two years are counted per individual story; the summary has a window of its own.
Viewer demographics don't appear straight away: they need a preset period from the list and more than a hundred accounts reached or engaged. Over seven days a smaller account usually doesn't have them yet.
The drop-off curve you'll have to build by hand
Five minutes and a two-column table.
Since the platform gives no ready curve, you build one from what there is. The “Viewers” metric is counted for each frame separately, so a set of six frames gives you six data points.
Write out “Viewers” frame by frame: first, second, third. Work out what percentage of the first frame remains on each of the following ones. The place where the fall is sharper than usual is the frame where people close you.
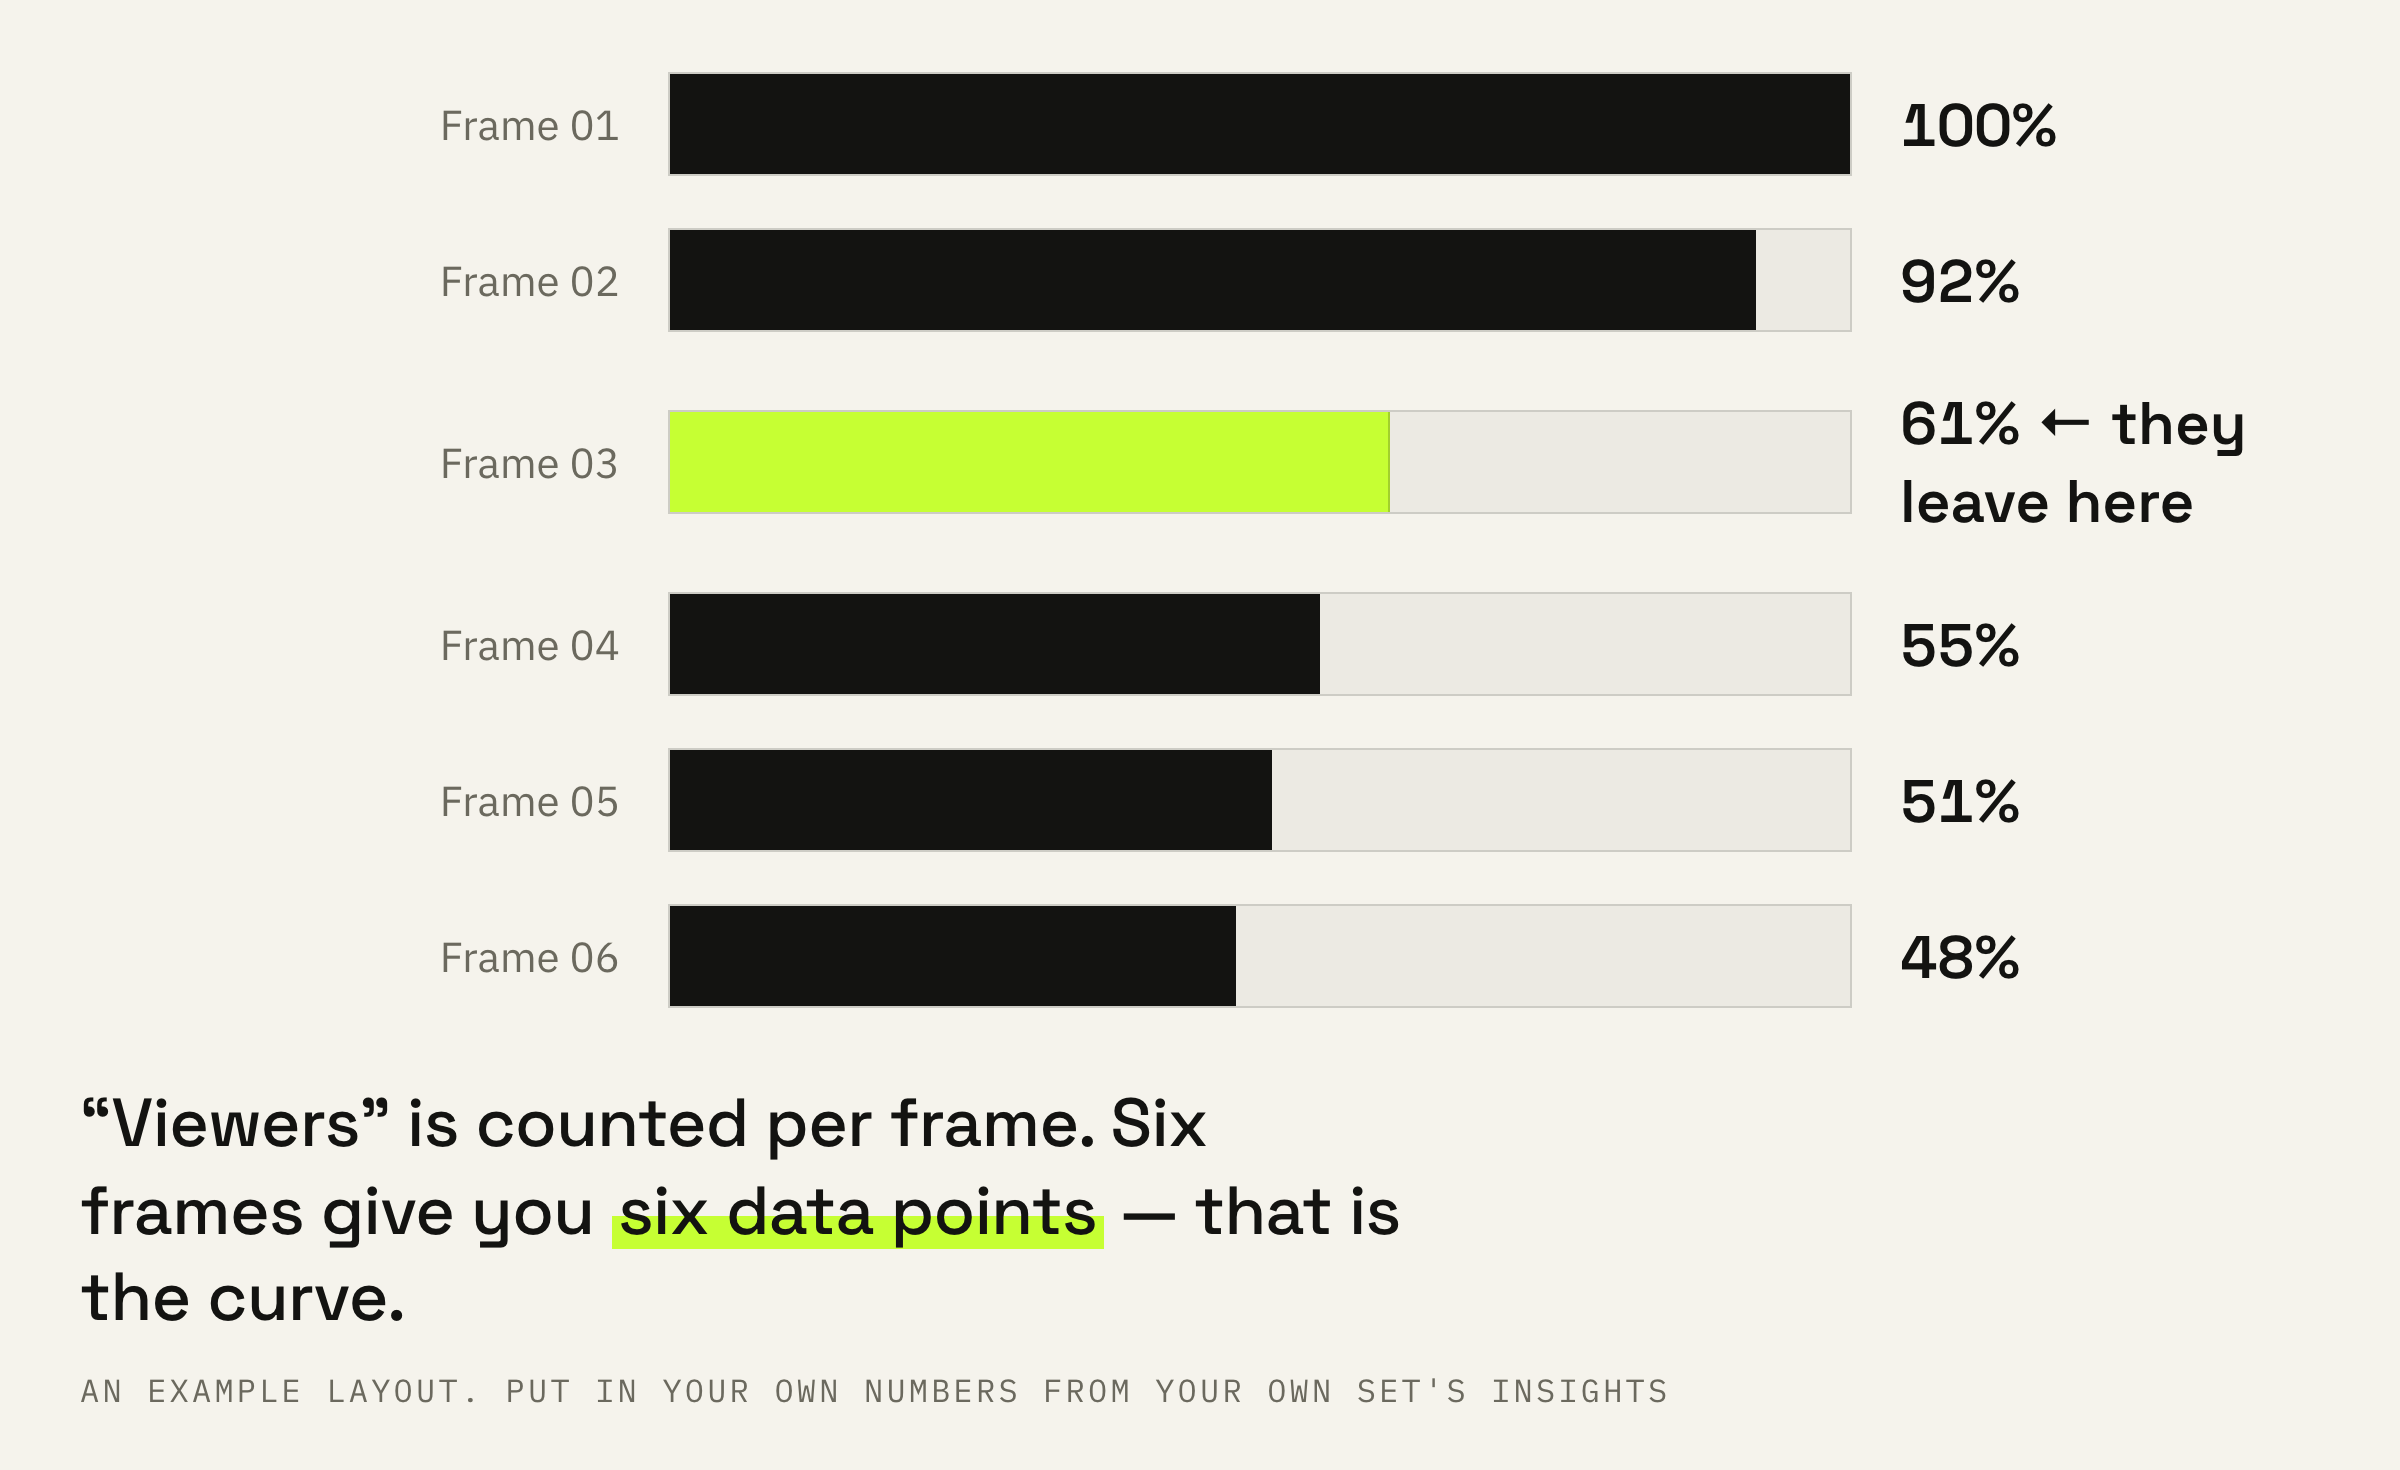
From there it stops being guesswork. You open the frame where people leave and look at it: long text in small type, a dull transition, a promise with no payoff, a third frame in a row about the same thing.
We do this by hand, and it is dull work: writing out six numbers for every set from the week. But it answers the question “what to fix” instead of the answer “reach dropped”.
Ten predictions: attention and exit
What the system predicts before it builds the tray.
The card lists ten predictions. They fall into three groups, and each tells you something different to do.
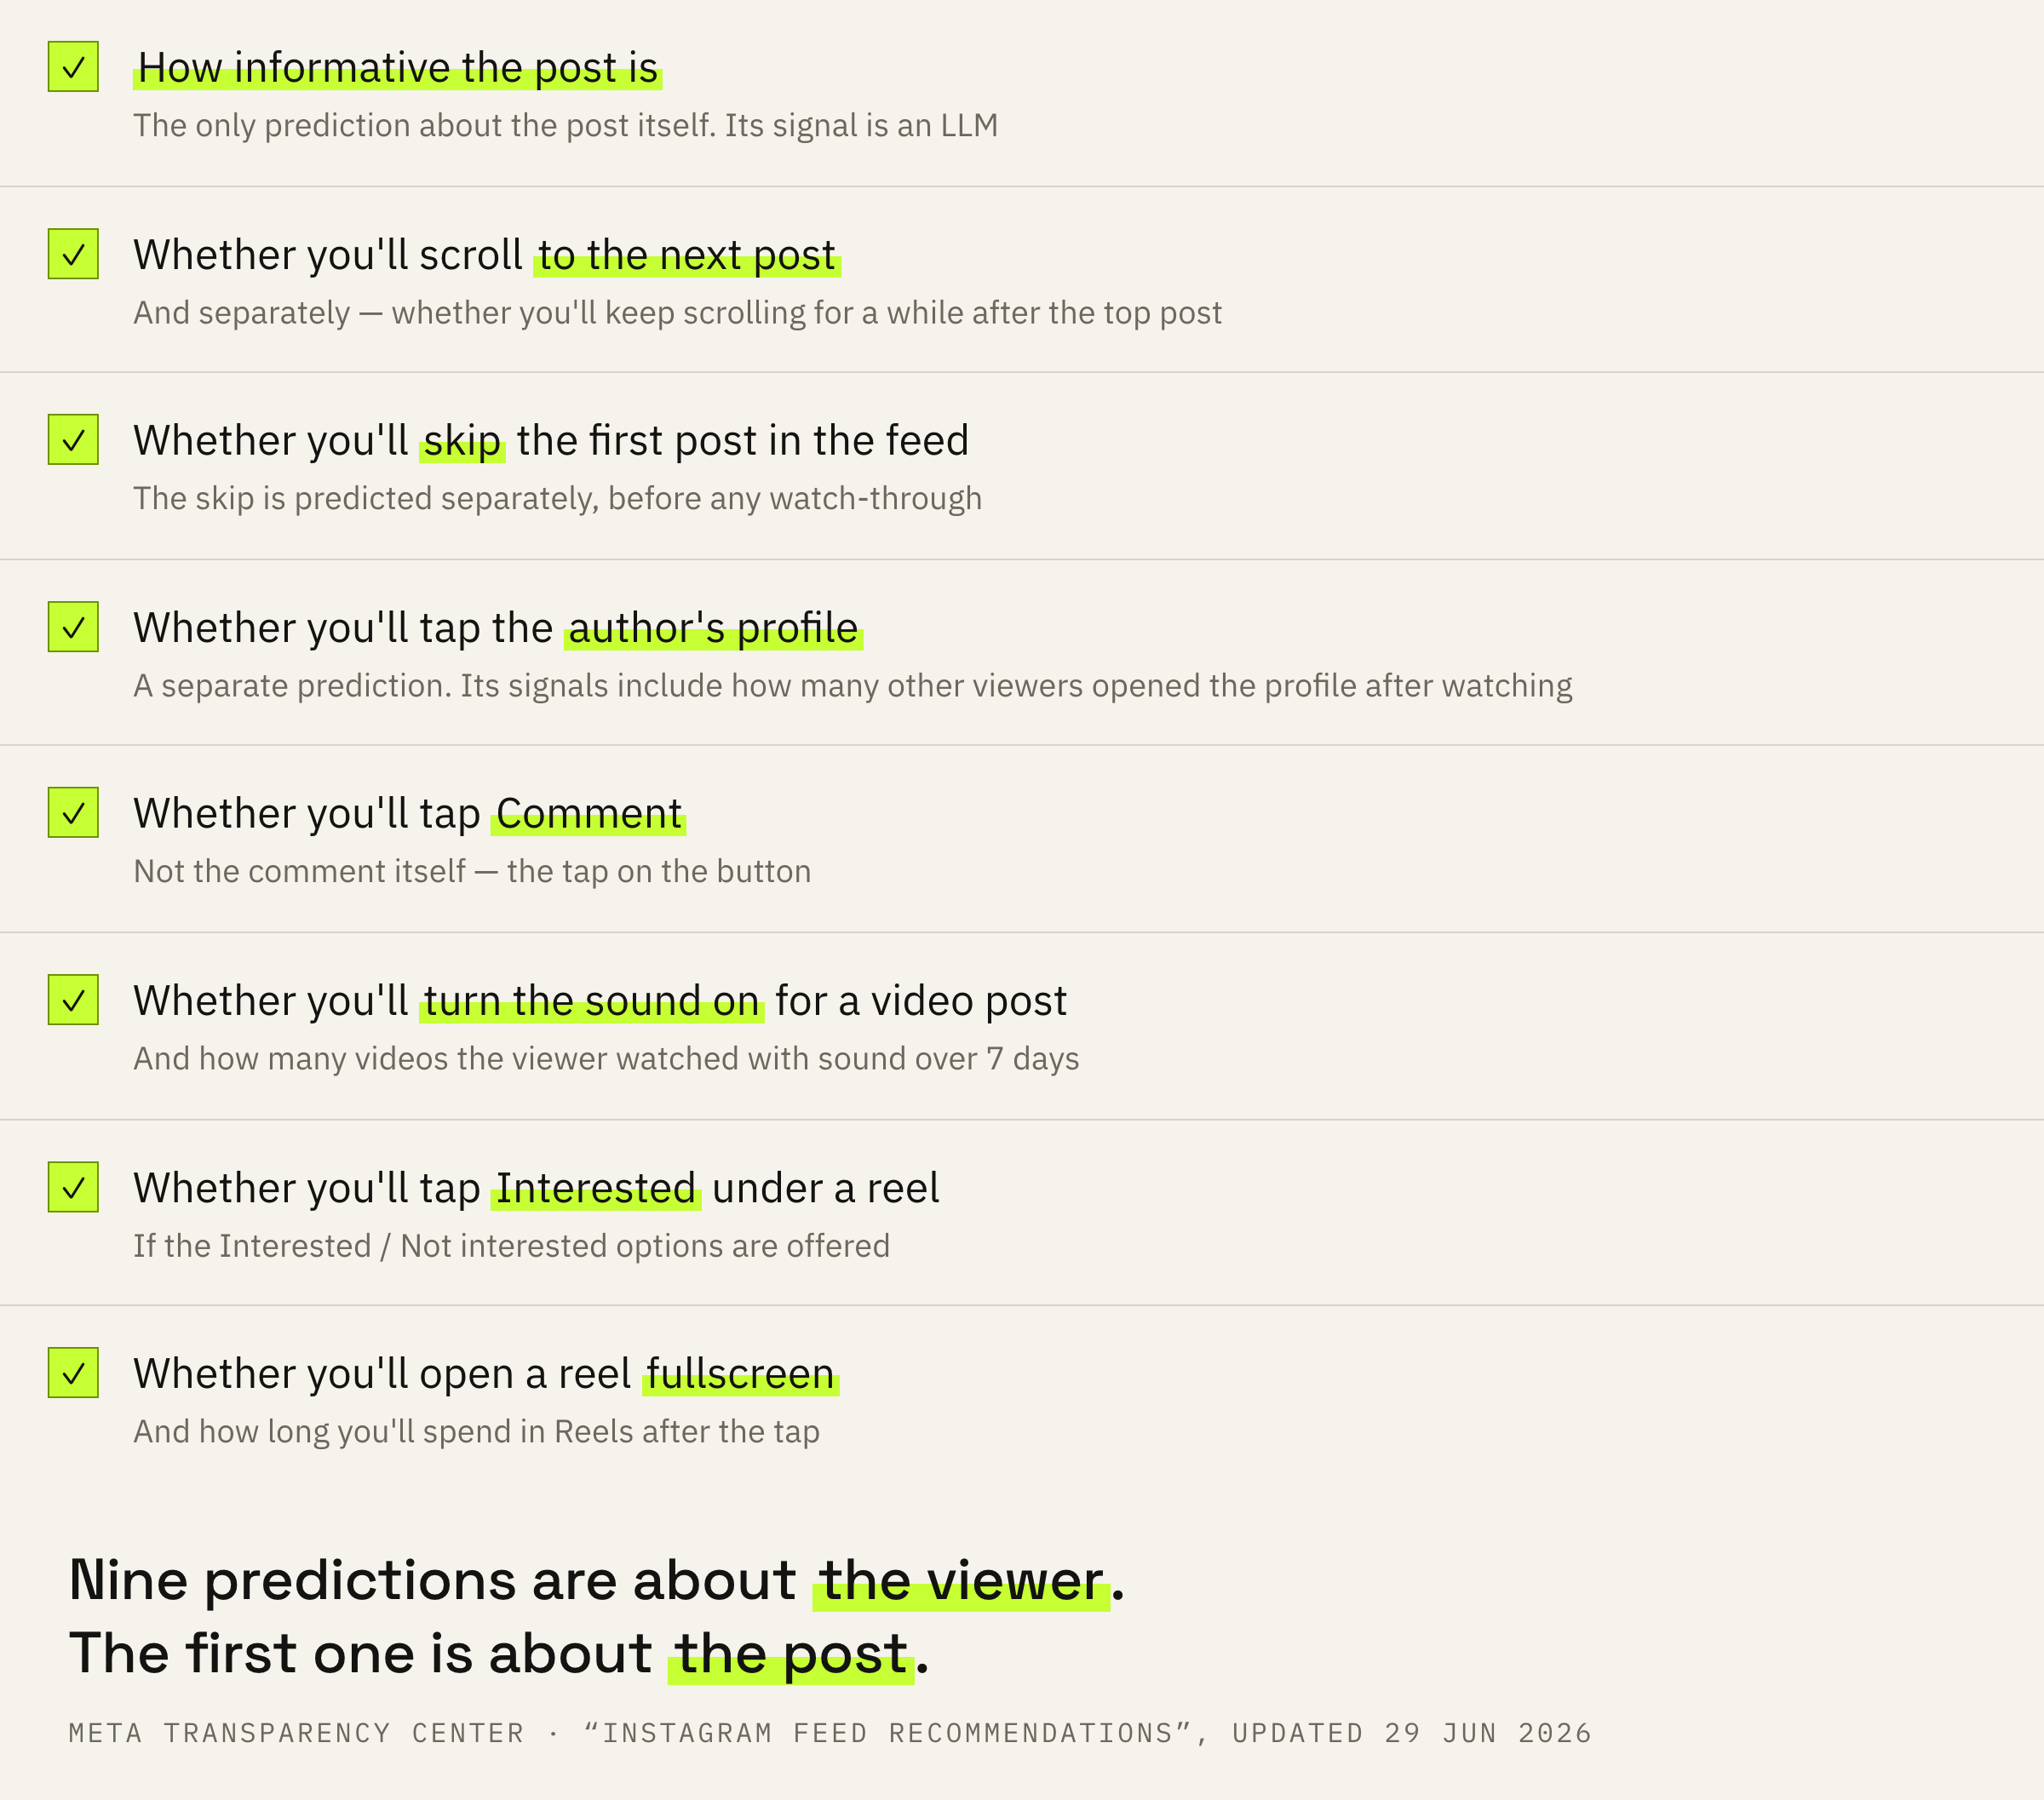
The first group is about opening: whether you will tap the story sitting at the top of the home screen. The system also looks here at how many times a person has opened your stories before.
The second is about action inside the frame: whether you will answer a question sticker, tap “Like”, reply in DMs, open the author's profile, or vote in a poll or slider.
The third is about leaving: whether you will swipe to the next story and whether you will exit the set. One signal here is how many times a person has closed stories with the X.
A question sticker, a poll and a slider are not frame decoration. They are separate predictions in the list of ten, and they are the only way a viewer can answer you without leaving the story.
There is a prediction here that no other surface has: “How likely it is that you and the story's author are family or good friends”. Among its signals the platform names how many messages you have sent each other, whether you are friends on Facebook and whether you talk outside Instagram.
You can't buy that volume with ads: money gets you an impression, not a conversation.
From a case breakdown where a single video collected 40,000 comments
For stories this works in its purest form. A DM reply weighs more here than a view, because it goes to two places at once: into the “will you reply” prediction and into the closeness signal that lifts you in the tray tomorrow.
If your stories are being watched worse and worse and the cause isn't clear, we'll look at a week of your sets and tell you which frame loses people.
What to change this week
Four steps, one change at a time.
First: compare thirty days against the previous thirty. Comparing this week against the best week of the quarter shows nothing. The platform warns separately that some metrics are approximate, so picking apart a few percent is pointless.
Second: build the frame curve as above. It separates “fewer people open us” from “people close us on the third frame” — two different illnesses with different cures.
Third: put the question sticker or poll in the first frame, not the last. An answer on the first frame is counted against the set a person actually reached. Not everyone reaches the last frame.
Fourth: shorten the set. A long run of frames from one author more often breaks off halfway — simply because the viewer runs out of patience. The platform names no specific threshold, so there is only one reference point here: your own exit numbers.
After two weeks build the frame curves for the new period and compare them with the old ones. Changed one thing — you'll see what helped. Changed everything at once — you'll find out only by accident.
What not to do
Four reactions that make things worse.
And the opposite extreme — stopping until things are clear. The “How many stories you have not seen” signal isn't going anywhere, while the viewer's habit of opening you every day disappears fast.
What to do next
One table for today.
Take your last three sets and write out “Viewers” frame by frame. That is five minutes and gives you three curves instead of one impression.
Then change one thing at a time: first the sticker's position, then the length of the set, then the first frame. Two weeks per change, or the answer will blur into the normal fluctuation.
We'll look at two weeks of your sets, build the frame curves and tell you what to change first.
If you want your stories to bring in requests again — leave a request. We'll get in touch if there are slots available at the moment. There is usually a queue and a wait.