How Explore is put together: three stages and ten predictions
Selection in the Explore tab goes in three stages, and among the ten predictions one counts the probability that you will tap “Not interested”. Plus two numbers: five seconds and 95 percent.
- Social media & AI
- Mechanics breakdown
- ≈ 9 min
The Explore tab has a system card of its own: three selection stages, ten predictions and forty-eight signals. One prediction in the list is built the other way round — it predicts that you will tap “Not interested”. Almost nobody writes about it, though it explains a lot.
The three selection stages, all ten predictions, the prediction about rejection and the two numbers the platform names directly: five seconds and ninety-five percent. Nine minutes of reading.
Retrieval, early-stage and late-stage ranking
The selection is described as a funnel of three steps.
The card describes the tab's work not as one decision but as a sequence. The platform's wording is short.
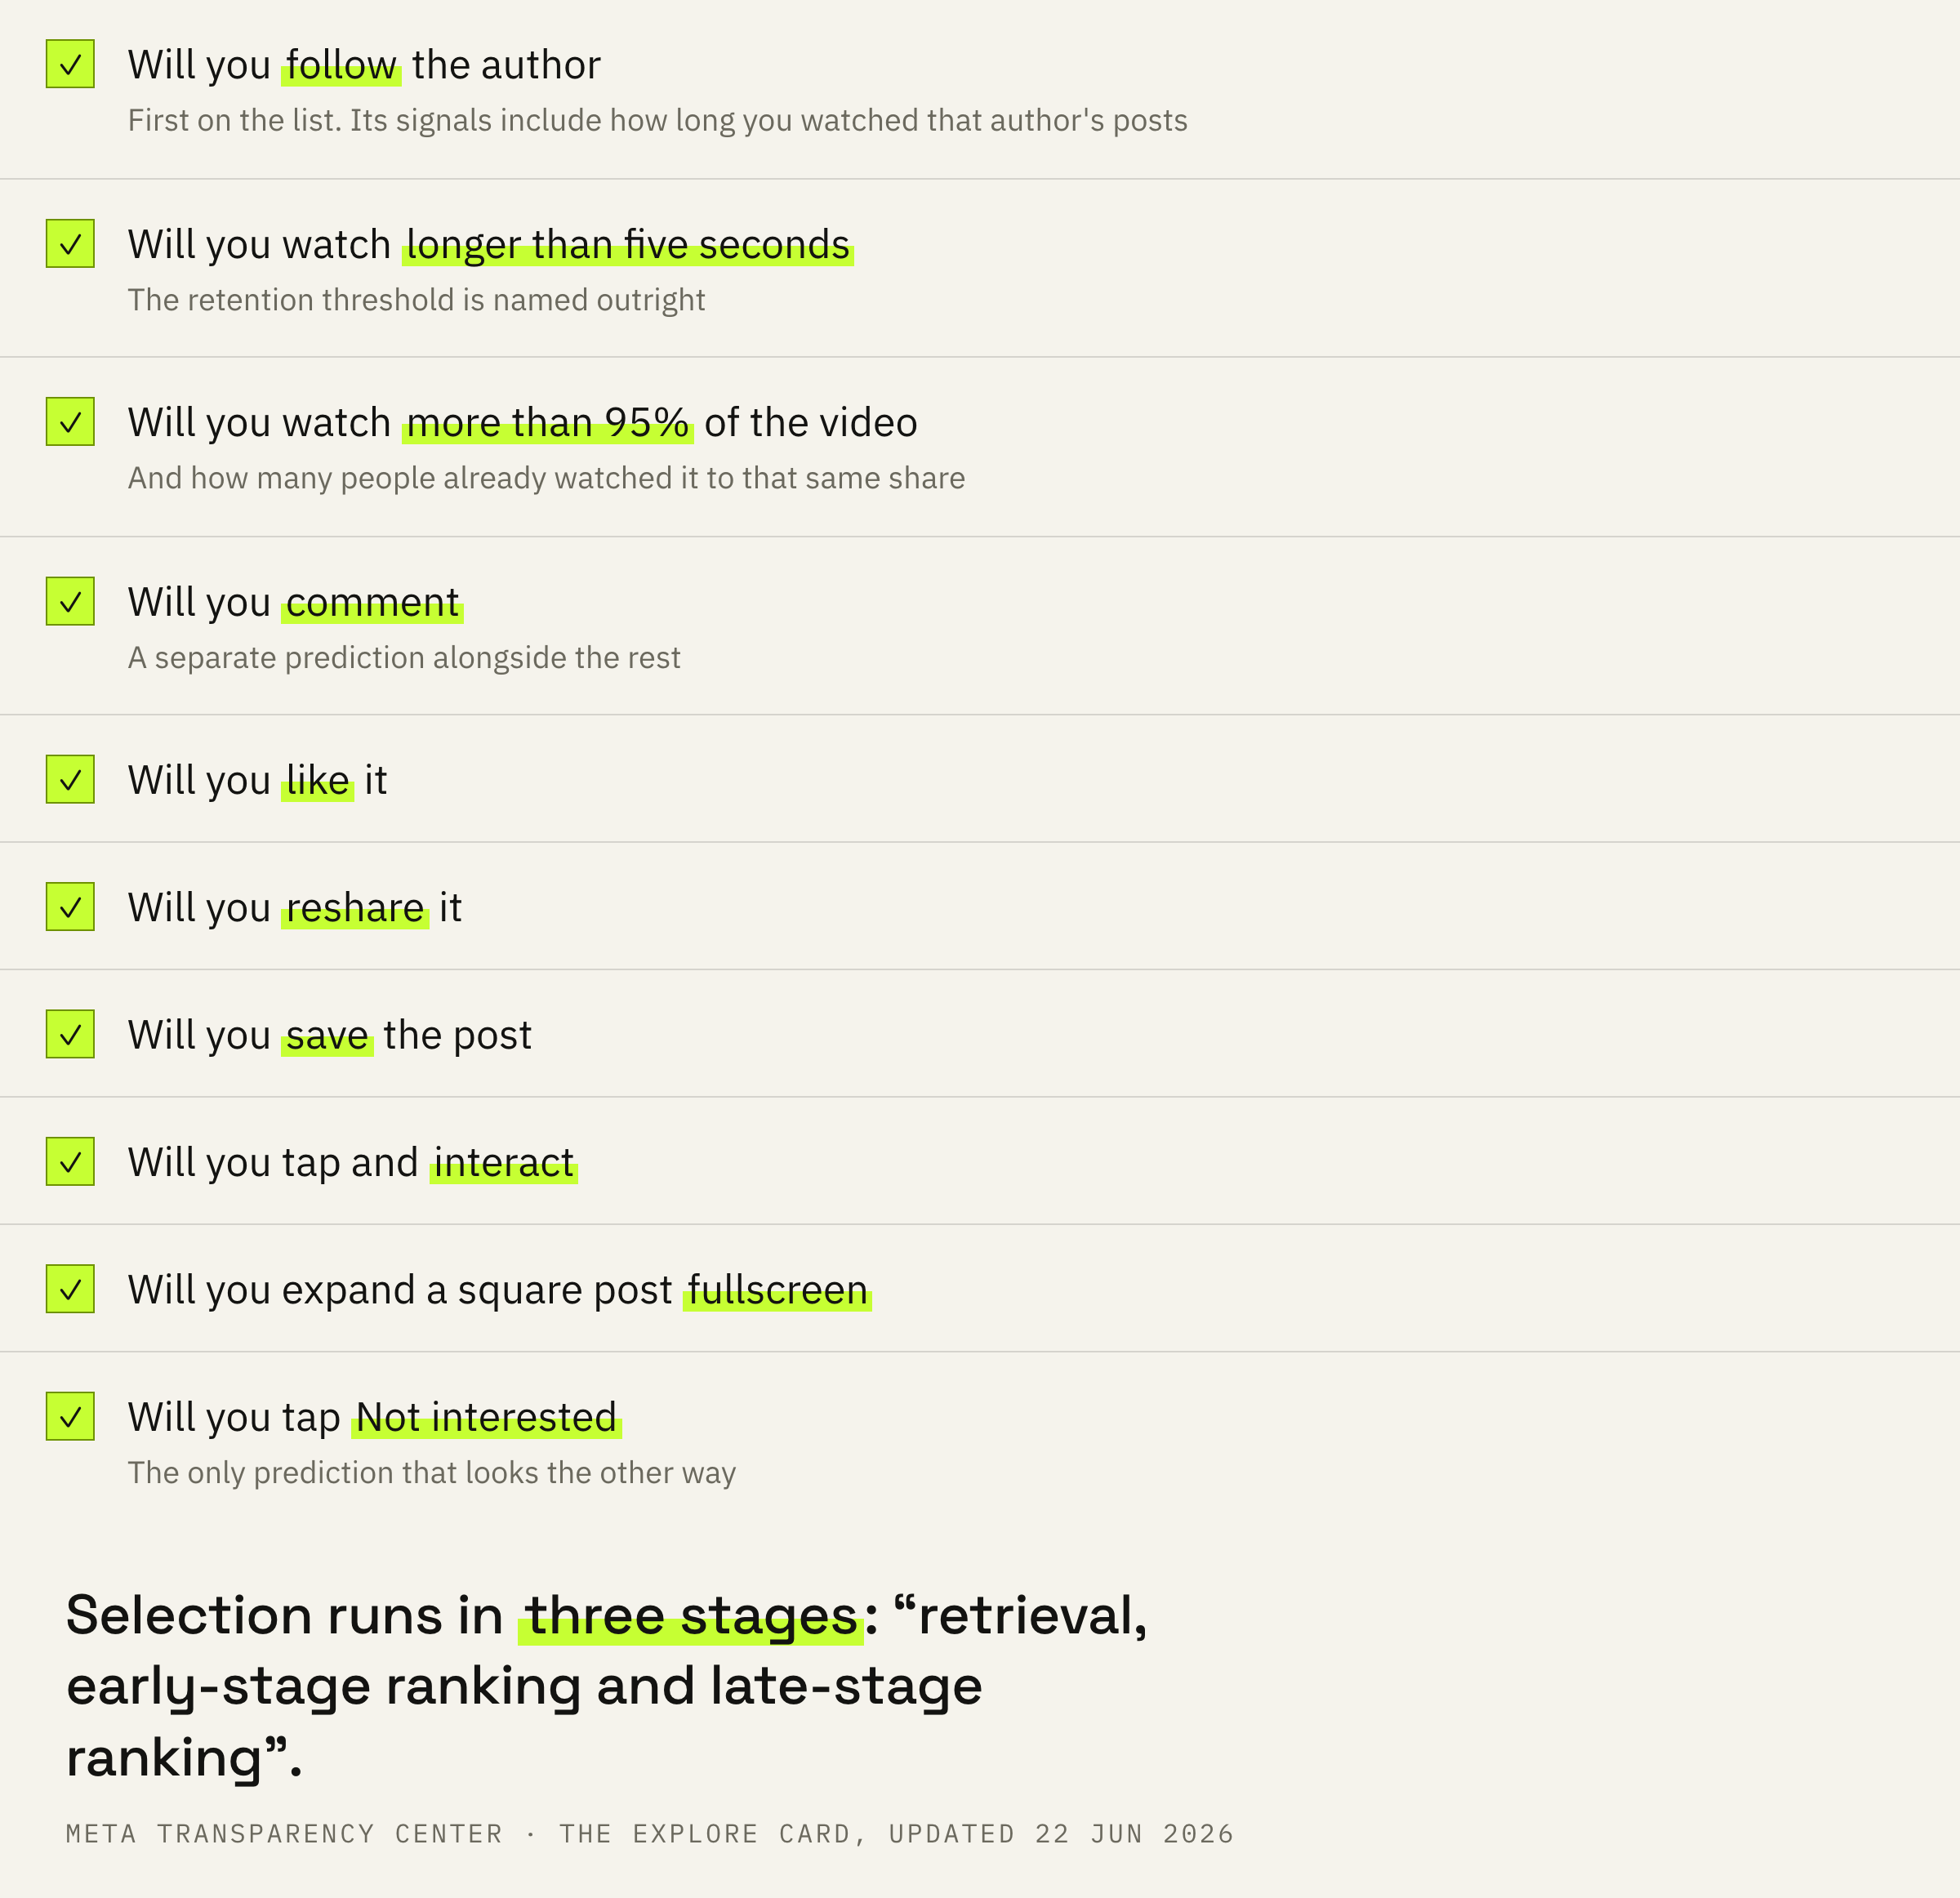
Three stages: retrieval, early-stage ranking and late-stage ranking.
Meta Transparency Center · the card for the Explore tab on Instagram
In practice that means getting into Explore is not a single event. First the post has to land in the candidate pool, then pass a rough sorting, and only after that is its place decided precisely.
Next come the ten predictions computed for every post. Whether you will follow the author. Whether you will view the post for longer than five seconds. Whether you will watch more than ninety-five percent of the video. Whether you will comment, tap “Like”, reshare, save, tap and interact, expand a square post to full screen.
The prediction that counts rejection
The tenth one on the list looks the other way.
Nine predictions predict what good you will do for the post. One predicts the opposite.
How likely you are to click “Not interested” on a post.
Meta Transparency Center · same place
The system doesn't just look for what you will like. It separately estimates the probability that you will want to remove it. And among the signals for that prediction sits the history of your refusals: how many authors you have already marked as not interesting.
For an author that changes the task. Being attractive to your own audience isn't enough — you also have to not be irritating to someone else's, because in Explore you are shown to exactly that someone else's audience.
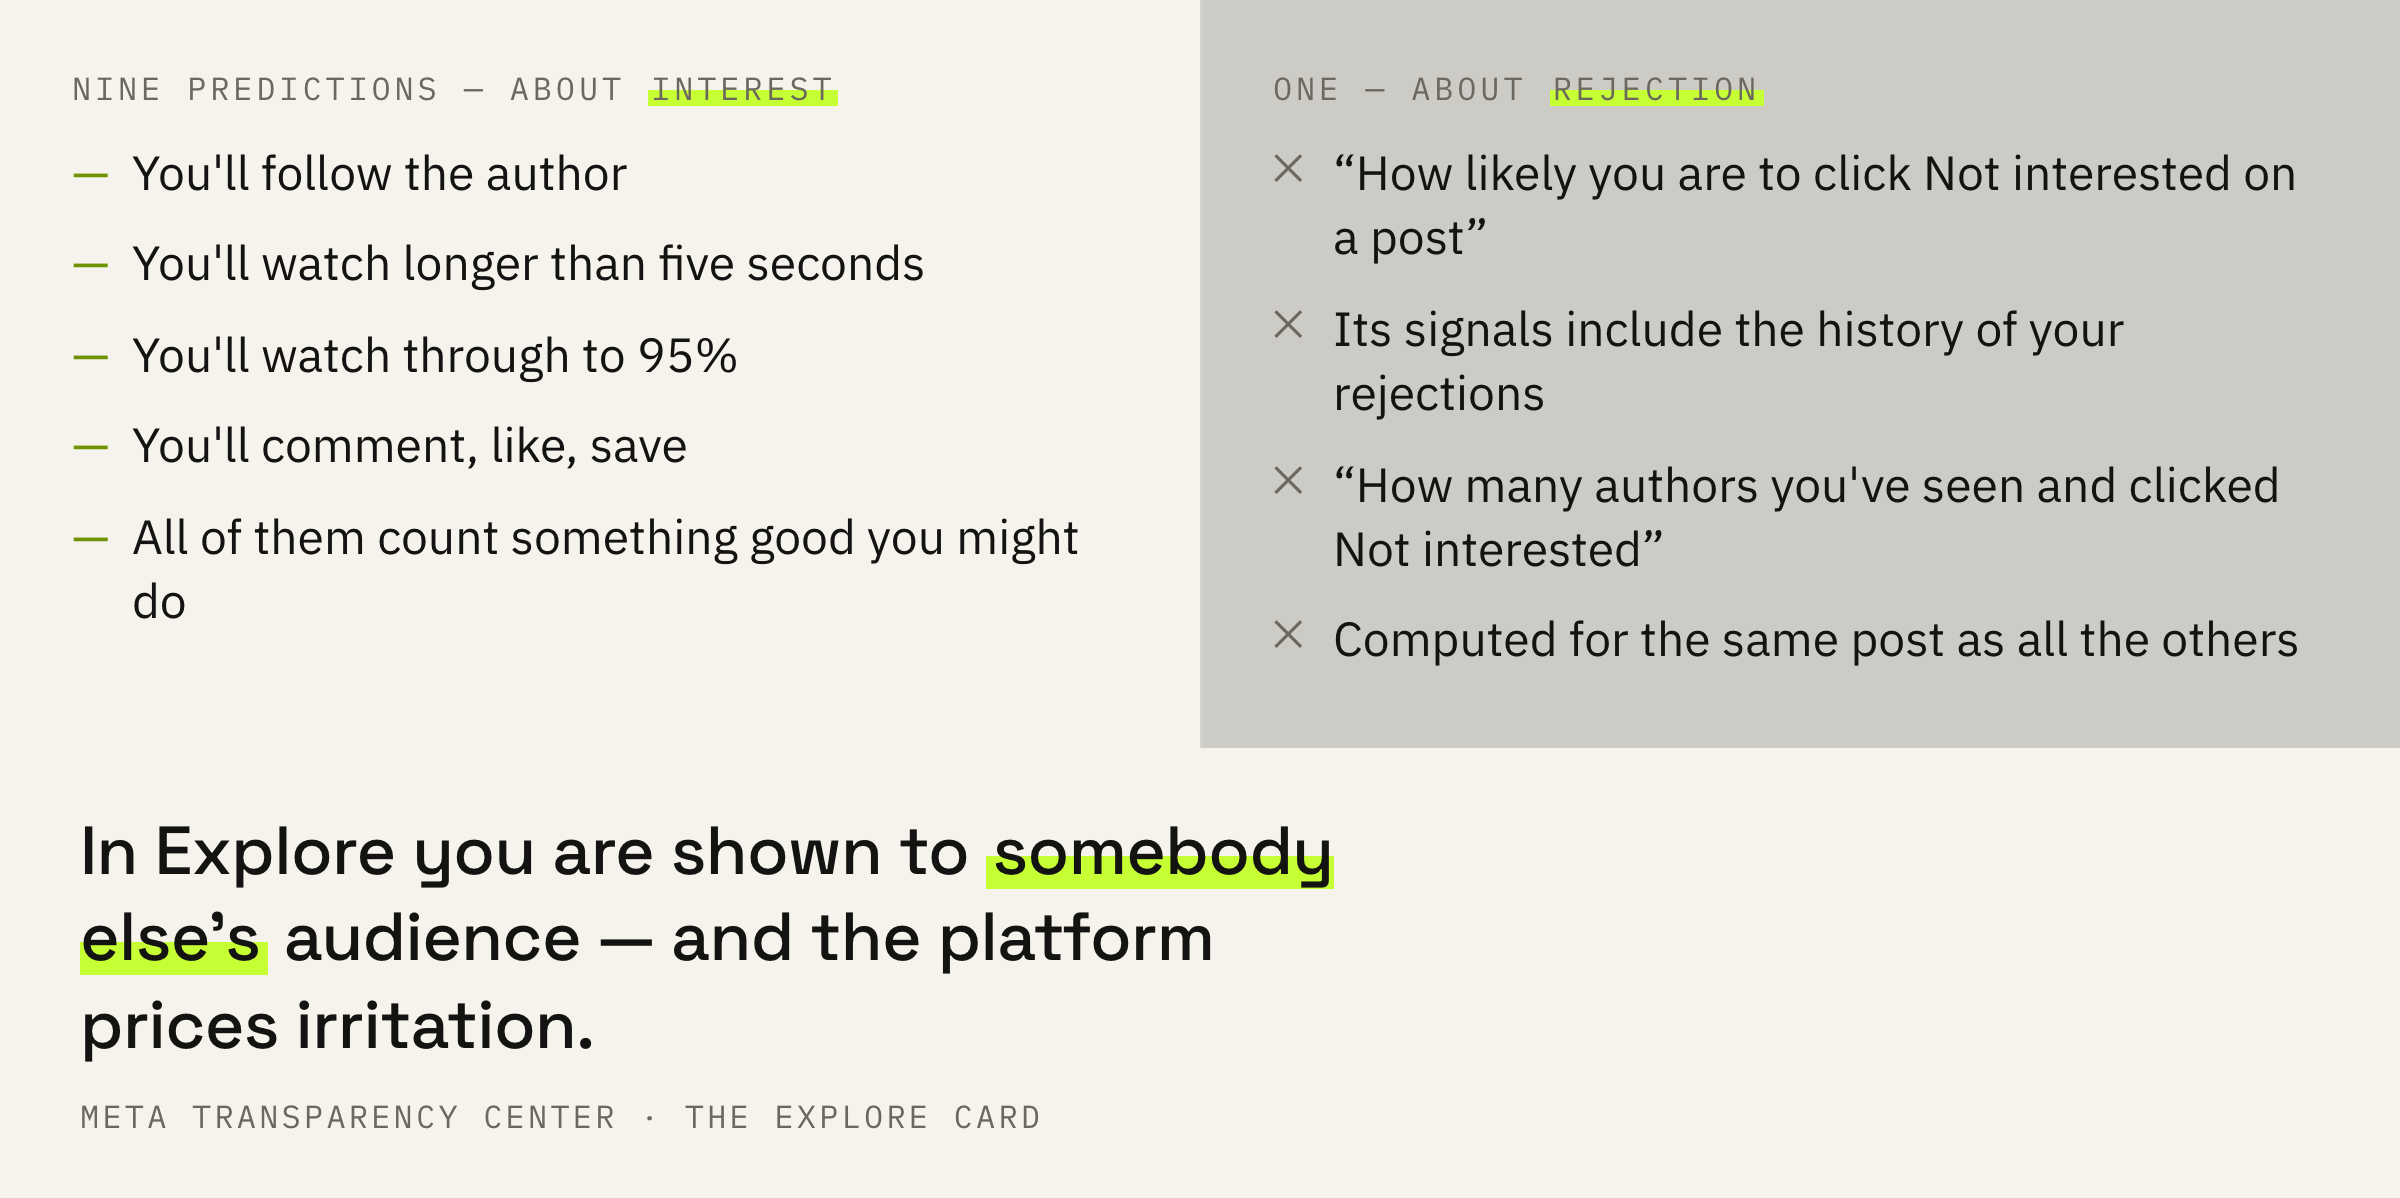
Tricks that buy attention at the price of irritation work against you twice in Explore: they don't raise the chance of a follow, and at the same time they raise the chance of a “Not interested”. This is the one place where the platform directly counts the price of clickbait.
Five seconds and ninety-five percent
Two thresholds that are named directly.
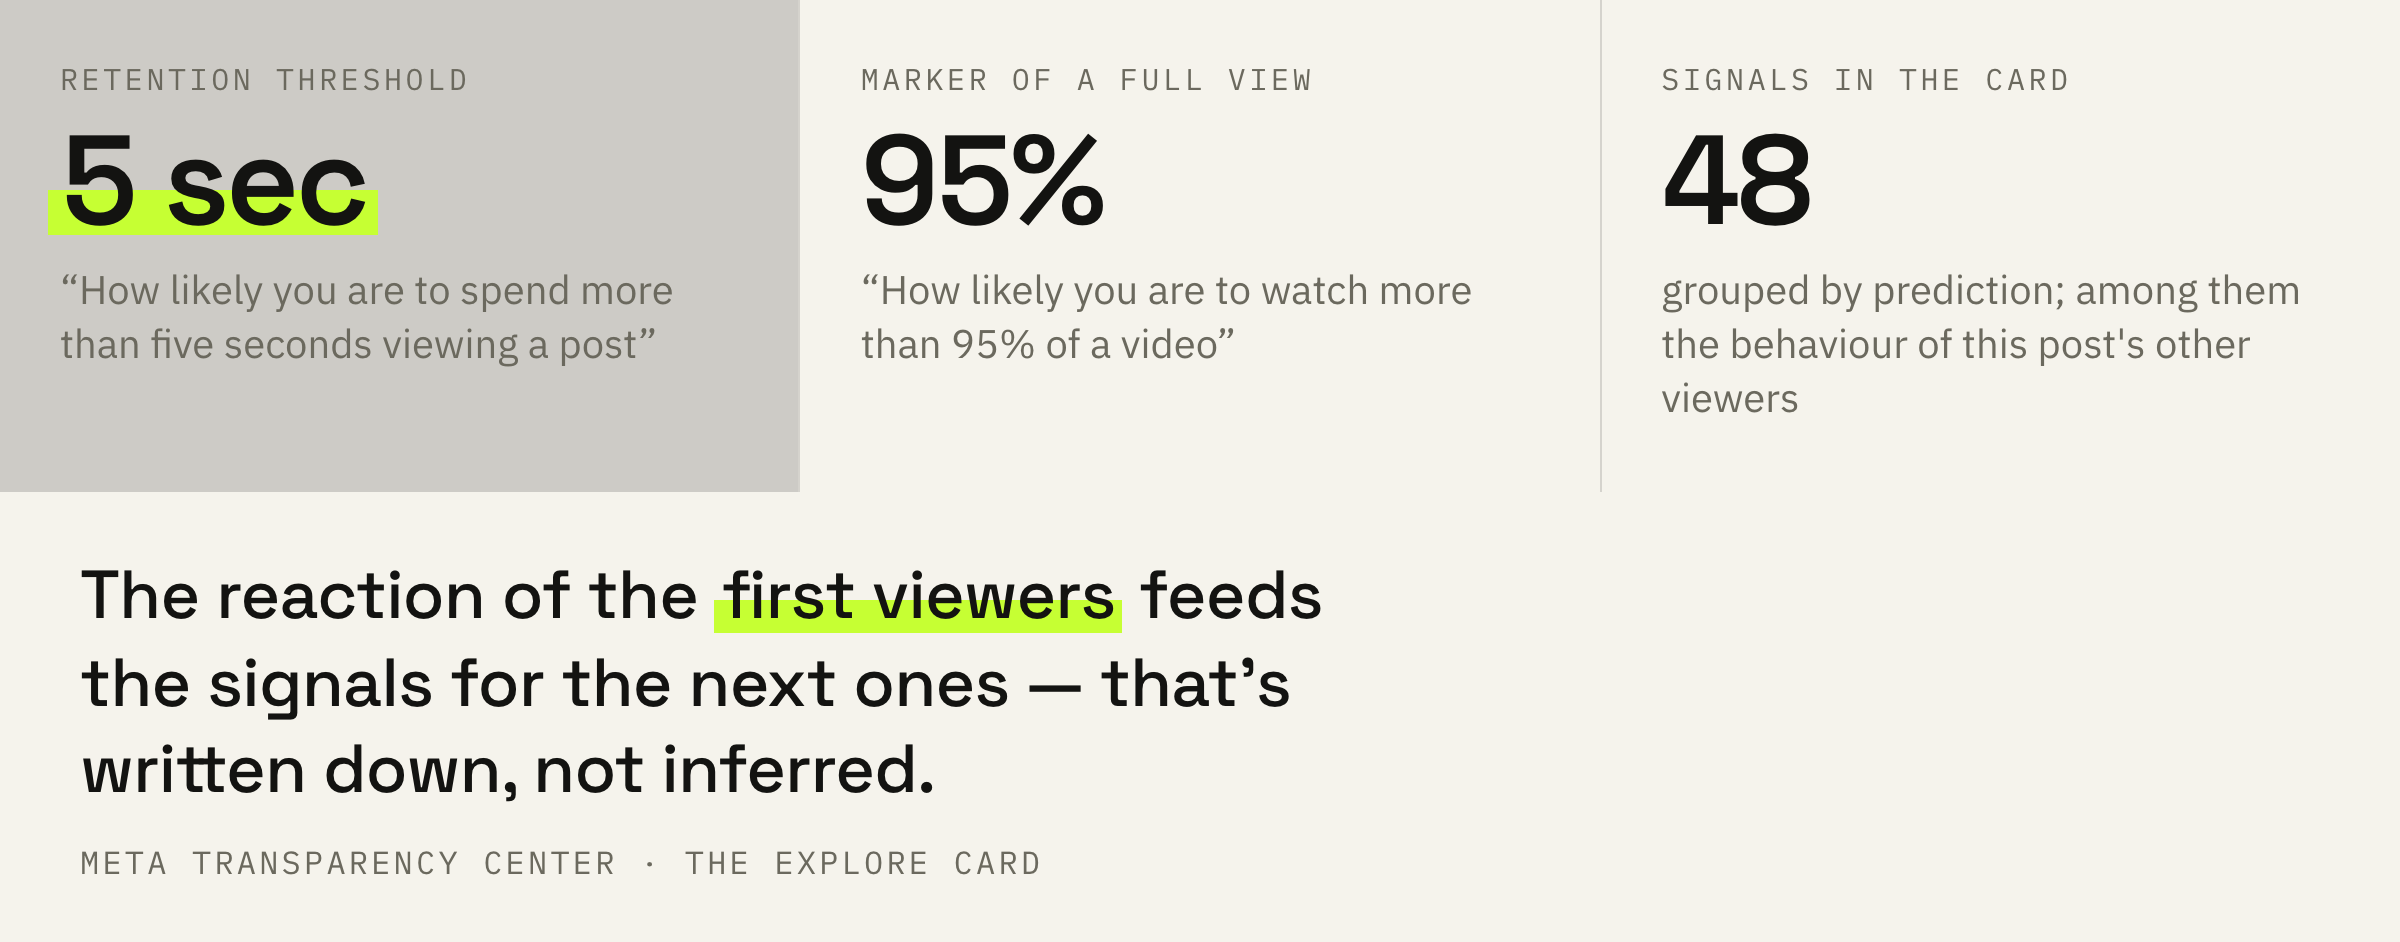
The wording of the predictions carries specific numbers, and that is rare. The first: “How likely you are to spend more than five seconds viewing a post”.
The second: “How likely you are to watch more than 95% of a video”. Not just “watch it through”, but exactly that share.
Both numbers describe the viewer; they are not a requirement placed on you. But they show which intervals the platform thinks in: five seconds as a retention threshold and ninety-five percent as a sign of a full view.
The neighbouring system — feed recommendations — has predictions and numbers of its own, and the two must not be mixed: a breakdown of the feed recommendations card.
It isn't only your behaviour that decides
The signals include the behaviour of other viewers.
The card's forty-eight signals mostly describe the viewer: what they watched, who they followed, how much time they spent. But there are others among them.
“How many people have seen the post on Explore”. “How many people have watched more than 95% of the video”. That is, when the post is scored for you, how people reacted to that same post before you is taken into account.
This is the snowball mechanic, only described by a document, without any guesswork. The first viewers influence whether the post gets shown to the next ones.
From here comes a practical conclusion people usually give at random, though it actually follows from the card: the first hours after publishing matter because the reaction of the first viewers enters the signals for everyone who comes next.
The card was updated on the twenty-second of June two thousand twenty-six and carries a direct warning: these models and their input signals are dynamic and change often as the system learns. Everything listed here is true as of the document's date.
If your posts don't reach strangers, we'll look at the recent ones and tell you what's in the way: admission, format or delivery.
What to do this week
Four steps that follow from the list of predictions.
First: look at your posts at the five-second mark. The prediction about retention is named directly, and that is the earliest line you influence.
Second: count the watch-through share. The number of views measures something else here. Ninety-five percent is the share the platform names as a separate prediction, and it measures something entirely different from the number of opens.
Third: review the tricks that rest on irritation. The prediction about “Not interested” exists, and it is computed for the same post as all the others.
Fourth: be around in the first hours. The reaction of the first viewers enters the signals for the next ones — that is written in the card, not inferred from someone else's experience.
Take ten posts and write the watch-through share next to the number of saves. If both grow, you've hit two predictions at once. If there are many views and no watch-through, you are buying the open and losing everything else.
What not to do
Four conclusions the card doesn't give.
And the general extreme: believing that Explore decides everything. Before it comes admission to recommendations, and if the account doesn't fit that, not one of the ten predictions applies: a breakdown of admission.
What to do next
Two minutes for today.
Open the stats for your latest post and find the watch-through share. If it isn't in the report, look at the average watch time — it is closer to what the platform counts than the number of opens.
If your posts don't reach strangers at all, check the originality of the material first: what Instagram treats as unoriginal.
We'll look at your posts and tell you at which of the predictions you lose the showing to strangers.
If you want to go beyond your own audience — leave a request. We'll get in touch if there are slots available at the moment. There is usually a queue and a wait.